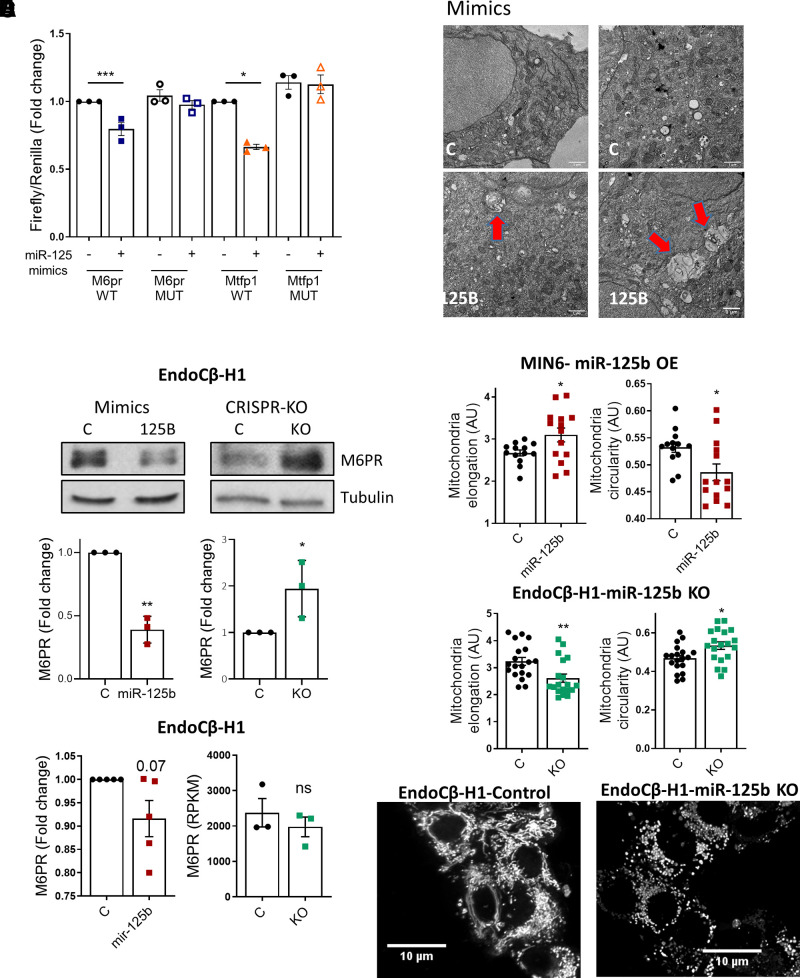
Figure 3.
MiR-125b represses M6pr and Mtfp1 and alters lysosomal and mitochondrial morphology. A: MIN6 cells were transfected with luciferase reporters containing the M6pr or the Mtfp1 3′UTRs with (mutated [MUT]) or without (wild type [WT]) two- to three-point mutations in the sequence complementary to the miR-125b seed. Control (−) or miR-125b (+) mimics were cotransfected and Firefly luciferase values normalized to Renilla. Each dot represents an independent experiment. B: Representative Western blot showing reduced (left panel) and increased (right panel) M6PR protein levels upon transfection with 1 nM miR-125b (miR-125b)/control (C) mimics or CRISPR-Cas9–mediated deletion of miR-125b in EndoCβ-H1 cells, respectively. Bar graphs show densitometry quantification of M6PR, using ImageJ, normalized by tubulin and presented relative to the control. C: Left panel: quantitative RT-PCR measurement of M6PR mRNA in EndoCβ-H1 cells transfected with control or miR-125b mimics, normalized by the housekeeping gene Ppia and presented as fold change of the control. Right panel: Normalized (reads per kilobase of transcript per million mapped reads) M6PR reads in control versus MIR125B2-KO (KO) EndoCβ-H1 cells. D: Representative TEM image of MIN6 cells transfected for 48 h with control or miR-125b (125B) mimics. Red arrows point to enlarged lysosomal structures. Scale bar = 1 μm. These were not observed in any of the imaged controls (n = 3 independent experiments). E and F: Quantitative analysis of mitochondria number and morphology on deconvoluted confocal images of (E) MIN6 cells transfected with miR-125b (red) or control (black) mimics or (F) EndoCβ-H1 with CRISPR/Cas9–mediated miR-125b deletion (green) or controls (black). Cells were stained with Mitotracker green. An ImageJ macro was generated and used to quantify individual mitochondria length (elongation) and circularity (0: elongated; 1: circular). Each dot represents one acquisition [n = 3 (E), n = 4 (F) independent experiments]. Lower panels show representative confocal images of the mitochondrial network of EndoCβ-H1-MIR125B2-KO and control cells. Scale bar: 10 μm. Error bars represent SEM. *P < 0.05, **P < 0.01, ***P < 0.001, paired Student t test of the log(fold change) values (A–C); Welch t test (E and F). a.u., arbitrary units; OE, overexpression.

