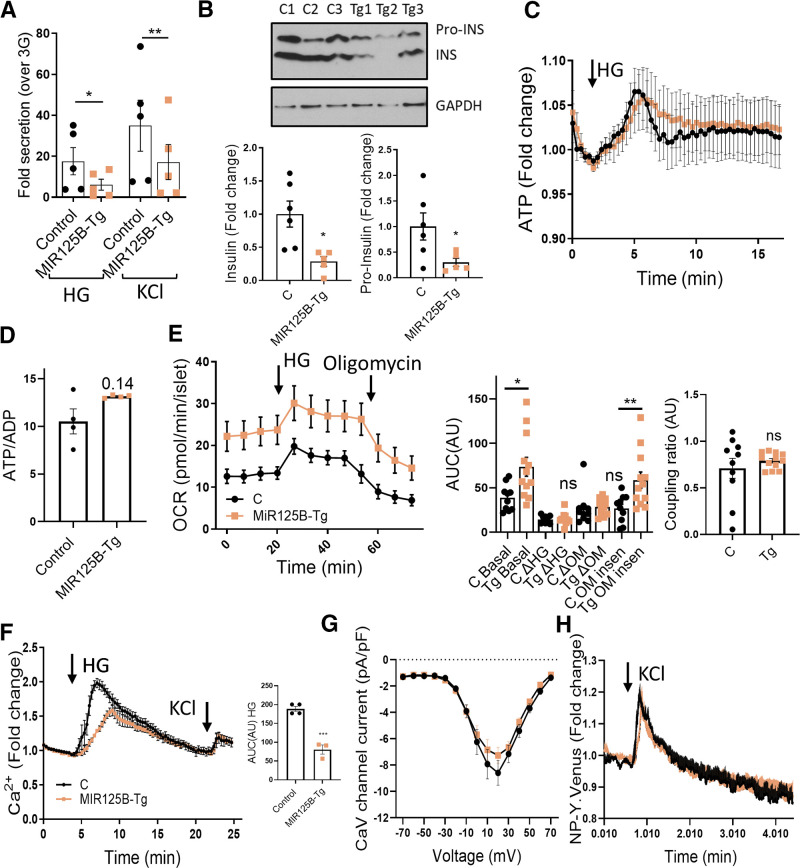
Figure 5.
MIR125B-Tg islets contain and secrete less insulin than do control islets. A: Fold induction insulin secretion versus low glucose (3 mM; LG) in response to 30-min high glucose (HG; 17mM) or KCl (17mM KCl and 3 mM glucose) in islets from 10- to 11-week-old control (RIP7-rtTA+/−) and MIR125B-Tg (RIP7-rtTA+/−, MIR125B Tg+/−) mice. B: Insulin (INS) and proinsulin (Pro-INS) content in 10-week-old control (C) and MIR125B-Tg (Tg) mice. A representative Western blot is shown with islets from three control and three MIR125B-Tg animals. Bar graphs show densitometry quantification of insulin and proinsulin, using ImageJ, normalized by GAPDH and presented relative to the average control. C and D: ATP levels increase in response to high glucose (17 mM vs. 3 mM) (C) and ATP to ADP ratio at 3 mM glucose in intact MIR125B-Tg and control islets infected with an adenoviral Perceval sensor (D). n = 4–5 mice/genotype, with 1–2 acquisitions per mouse and an average of five islets/acquisition. E: Oxygen consumption rate (OCR) measured in the presence of 3 mM or 17 mM (HG) glucose and 5 μM oligomycin (OM) over time, as indicated. Islets were preincubated for 1 h at 3 mM glucose. Left panel shows traces from the actual experiment. Middle and right panels show calculations during the indicated periods. “Basal” shows the area under the curve (AUC) under basal (3 mM) conditions; ΔHG and −ΔOM report the change in respiration when 17 mM glucose and oligomycin are added, respectively. The oligomycin insensitive value (OM insen) reports the residual respiration after the addition of oligomycin and coupling ratio (right panel) represents the oligomycin-sensitive respiration divided by respiration preceding oligomycin. Each dot represents a plate well with three to six size-matched islets (n = 10–12) extracted from three control (C) and four MIR125B-Tg (Tg) mice. F: Ca2+ concentration increases in response to high glucose (17 mM vs. 3 mM) and KCl (20 mM KCl, 3 mM glucose) in intact MIR125B-Tg and control islets incubated with Cal-520. n = 4–5 mice/genotype, with one to two acquisitions per mouse and an average of five islets/acquisition. AUC corresponding to HG incubation was determined and is presented in the bar chart. G: Average maximum voltage-dependent Ca2+ current densities recorded from control and MIR125B-Tg β cells in response to 10 mV steps from −70 to 70 mV. n = 16 and 29 β cells from two control and four MIR125B-Tg mice. H: NPY-Venus fluorescence increases in response to 20 mM KCl in cells from dissociated MIR125B-Tg and control islets infected with an adenoviral NPY-Venus sensor. n = 3–4 control mice/genotype with two acquisitions per mouse and one to two β cells per acquisition. Each dot represents a single mouse in all graphs unless otherwise indicated. Error bars represent SEM. *P < 0.05, **P < 0.01, ***P < 0.001, two-way ANOVA (repeated-measures) and Bonferroni multiple comparisons test (A), paired Student (B) and unpaired Welch (D and E) or Student t test (F). Δ, change in; a.u., arbitrary units; ns, not significant.

