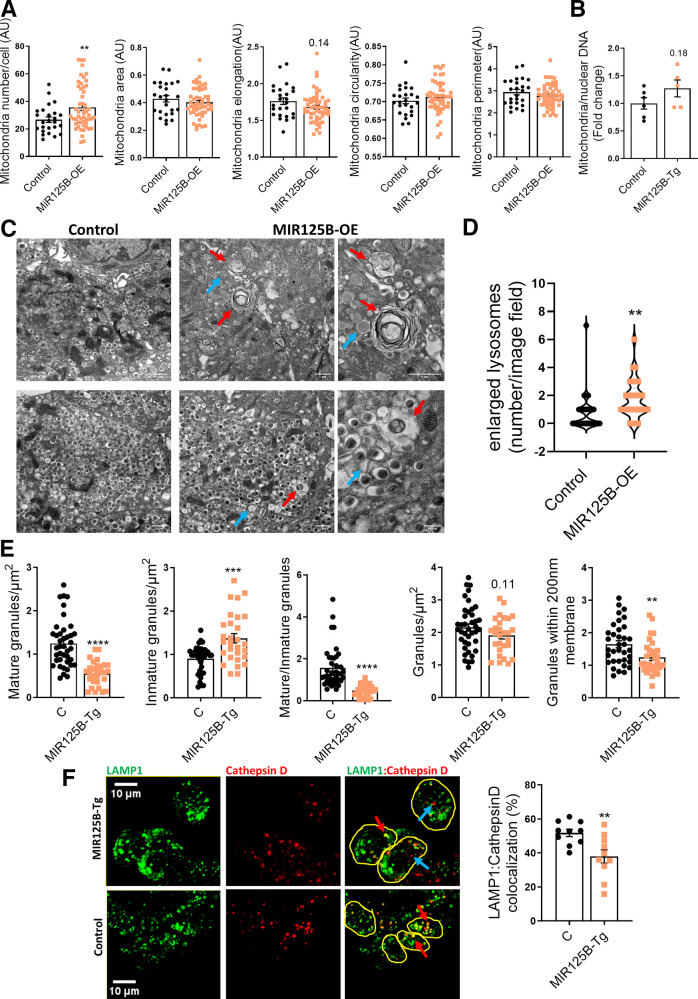
Figure 6.
Enlarged lysosomes and autophagolysosomes are abundant in miR-125b transgenic islets. A: Quantitative analysis of mitochondria number and morphology on deconvoluted confocal images of dissociated MIR125B-Tg and control islets from 10- to 11-week-old mice. Cells were stained with Mitotracker green. An ImageJ macro was generated and used to quantify the number of mitochondria per cell, total mitochondria area, individual mitochondria length (elongation), circularity (0: elongated; 1: circular), and perimeter. Each dot represents one cell (n = 3 mice/genotype). B: Mitochondrial DNA copy number, calculated as the ratio of the mitochondrial encoded gene mt-Nd1 to the nuclear Cxcl12. Each dot represents a single mouse. C: Representative TEM images of MIR125B-Tg and control β cells. Red arrows: enlarged lysosomes with undigested cargos. Blue arrows: noncrystalized insulin granules, showing a rod-like structure or a gray interior. Scale bar = 1 μm, except 40 nm in right-hand side panels. D: Number of enlarged lysosomes per field imaged. E: β-cell granule density. D and E: Each dot represents one image (n = 3 mice/genotype, 9–13 images/mouse). F: Representative confocal microscopy images of β cells within MIR125B-Tg and control islets immunostained with anti-cathepsin D (red) and anti-LAMP1 (green) antibodies. Yellow circles represent individual cells. Blue arrows show examples of only cathepsin-positive particles and red arrows show particles positive for both LAMP1 and cathepsin D staining. ImageJ was used to quantify cathepsin D and LAMP1–stained particles within each cell, represented in the accompanying bar chart as a percentage of LAMP1-positive particles per cell. Each dot represents an individual islet with an average of three to eight cells quantified per islet, extracted from two control (C) and two MIR125B-Tg mice. Error bars represent SEM. *P < 0.05, **P < 0.01, ****P < 0.0001, Welch t test.

