Figure 7.
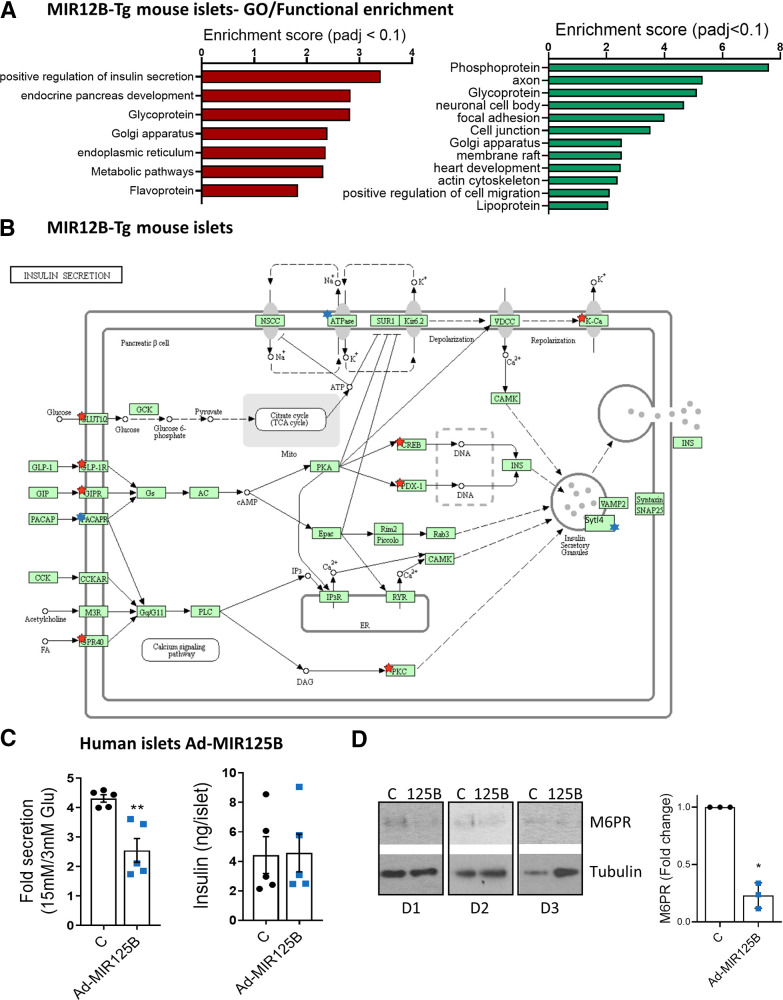
MiR125b overexpression alters gene expression in mouse and human islets. A: GO analysis of significantly (Padj < 0.1) downregulated (left, red) and upregulated genes (right, green) in MIR125B-Tg islets from 6-week-old mice versus control mice, performed with the Database for Annotation, Visualization and Integrated Discovery. The graph shows enrichment scores for one representative term for each cluster grouped by semantic similarities and including terms with Padj (Benjamini) < 0.05. See Supplementary Table 6 for a full list of terms. B: Kyoto Encyclopedia of Genes and Genomes pathway “Insulin secretion.” Red and blue stars indicate significantly down- and upregulated genes in MIR125B-Tg islets versus control islets, respectively. Sytl4 (granuphilin) has been manually added to the pathway. C: GSIS (left panel) and insulin content (right panel) quantified after 30 min of 15 mmol/L glucose stimulation after 1 h preincubation at 3 mmol/L glucose of human islets infected with adenovirus expressing miR-125b (Ad-MIR125B) or a nontargeting control (C) at a multiplicity of infection (MOI) of 5 MOI 48 h before the experiments. GSIS data are presented as fold change of basal level. Each dot represents an independent experiment performed with islets from two different donors. D: Western blot showing reduced M6PR protein-level infection of dissociated human islets from three different donors (D1, D2, D3) infected with Ad-MIR125B or control adenovirus (MOI = 2) for 48 h. Bar graphs show densitometry quantification of M6PR, using ImageJ, normalized by tubulin and presented relative to the control.

