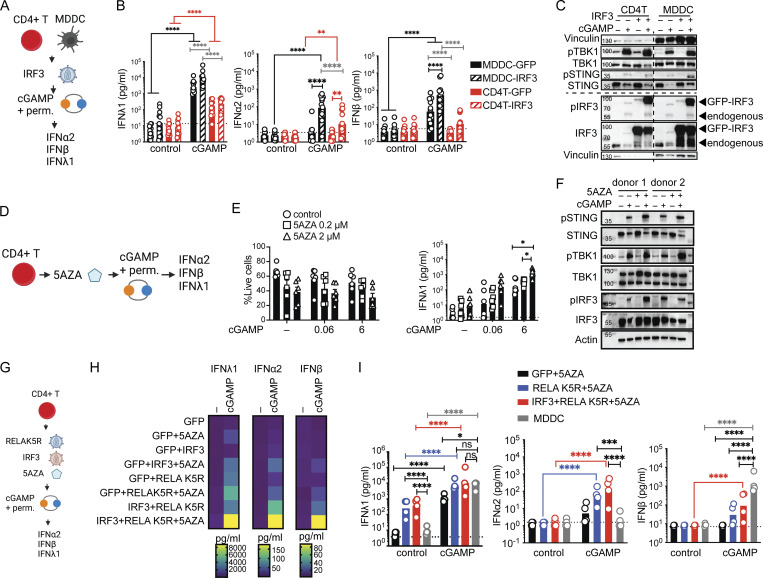
Figure 4.
IRF3 and a DNA methylation inhibitor synergize with RELA K5R to fully lift the IFN-I/III restriction in CD4+ T cells. (A) cGAMP stimulation in CD4+ T cells and MDDCs transduced with IRF3 lentivectors, outline of the experiment. (B) IFN-I/III concentration after cGAMP (6 µg/ml) stimulation of CD4+ T cells and MDDCs transduced with either control or IRF3 (n = 12 donors combined from six independent experiments). (C) Western blot of key signaling proteins involved in STING signaling and actin 6 h following cGAMP (6 µg/ml) stimulation of CD4+ T cells and MDDCs transduced with either control or IRF3 lentivectors (representative of two independent experiments). (D) cGAMP stimulation in CD4+ T cells treated with a DNA methylation inhibitor (5AZA), outline of the experiment. (E) Viability (mean + SEM) and IFNλ1 concentration (geometric mean) following 5AZA (2 µM) treatment and cGAMP (0.06, 6 µg/ml) stimulation of CD4+ T cells (n = 6 donors from three independent experiments). (F) Western blot of key signaling proteins involved in STING signaling and actin 6 h following cGAMP (6 µg/ml) stimulation of CD4+ T cells pretreated for 48 h with 5AZA (2 µM; representative of two independent experiments). (G) cGAMP stimulation in CD4+ T cells treated with a DNA methylation inhibitor (5AZA) and transduced with RELA K5R and IRF3 lentivectors, outline of the experiment. (H) Heat-map showing IFN-I/III concentration following cGAMP (6 µg/ml) stimulation of CD4+ T cells transduced with control (GFP), IRF3, RELA K5R, and pretreated for 48 h with 5AZA (2 µM; n = 8 donors combined from four independent experiments, geometric mean). (I) IFN-I/III concentration following cGAMP (6 µg/ml) stimulation of untransduced MDDCs and CD4+ T cells transduced with control (GFP), IRF3, RELA K5R and treated for 48 h with 5AZA (2 µM; n = 4 donors combined from two independent experiments). Each symbol represents one donor, bars represent geometric mean, paired one-way ANOVA with Tukey’s multiple comparison test, *P ≤ 0.05, **P ≤ 0.01, ***P ≤ 0.001, ****P ≤ 0.0001. Figure was generated using Biorender. Source data are available for this figure: SourceData F4.

