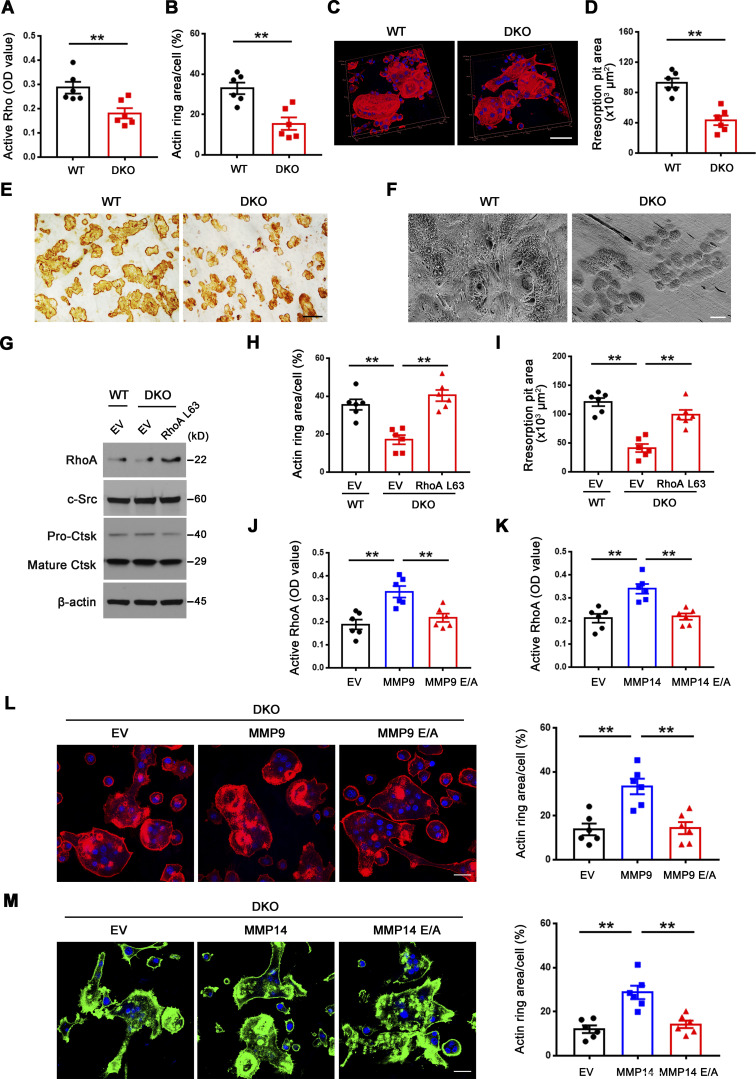
Figure 2.
Mmp9/Mmp14-dependent RhoA activation and cytoskeletal organization. (A) RhoA activity of wild-type and DKO osteoclasts cultured on plastic upon activation with 20 ng/ml M-CSF and 30 ng/ml RANKL for 15 min (n = 6 biological replicates). (B and C) After a 6-d culture atop bone slice, phalloidin staining (red) was performed in wild-type versus DKO osteoclasts (C), and actin ring area per cell quantified (B). Scale bar, 50 μm. Data are presented as mean ± SEM (n = 6 biological replicates). (D and E) Wild-type or DKO osteoclasts were removed from bone slices, resorption pits visualized by WGA-DAB staining (E), and resorption pit area quantified (D). Scale bar, 100 μm. Data are presented as mean ± SEM (n = 6 biological replicates). (F) Resorption pits generated on bone slice by wild-type and DKO osteoclasts were imaged by scanning electron microscopy. Scale bar, 10 μm. Results are representative of three independent experiments. (G) RhoA, c-Src, and Ctsk expression in empty vector (EV)–transduced wild-type osteoclasts, and EV- or ca-RhoA–transduced DKO osteoclasts, as assessed by Western blot. Results are representative of three independent experiments. (H and I) EV-transduced wild-type pre-osteoclasts, and EV- or ca-RhoA–transduced DKO pre-osteoclasts were cultured atop bone slices for 3 d and stained by phalloidin along with actin ring area per cell quantified (H). Data are presented as mean ± SEM (n = 6 biological replicates). Osteoclasts were removed and resorption pits visualized by WGA-DAB staining and resorption pit area quantified (I). Data are presented as mean ± SEM (n = 6 biological replicates). (J) DKO BMDMs were transduced with lentiviral vectors expressing full-length MMP9, an MMP9E/A mutant, or an empty control and differentiated into osteoclasts, and RhoA activity assessed upon activation with 20 ng/ml M-CSF and 30 ng/ml RANKL for 15 min. Data are presented as mean ± SEM (n = 6 biological replicates). (K) DKO BMDMs were transduced with lentiviral vectors expressing full-length MMP14, MMP14E/A, or an empty control and differentiated into osteoclasts, and RhoA activity assessed upon activation with 20 ng/ml M-CSF and 30 ng/ml RANKL for 15 min. Data are presented as mean ± SEM (n = 6 biological replicates). (L) MMP9- or MMP9E/A-transduced pre-osteoclasts were cultured atop bone slices for 3 d, and F-actin stained with phalloidin (red), and actin ring area per cell quantified. Data are presented as mean ± SEM (n = 6 biological replicates). Scale bar, 20 μm. (M) MMP14- or MMP14E/A-transduced pre-osteoclasts were cultured atop bone slices for 3 d, and F-actin staining (green) and quantification assessed as described in L. Scale bar, 20 μm. Data are presented as mean ± SEM (n = 6 biological replicates). **P < 0.01. Statistical significance was assessed using unpaired two-sided Student’s t test (A, B, and D) and one-way ANOVA (H–M) with Bonferroni correction (H–M). Source data are available for this figure: SourceData F2.

