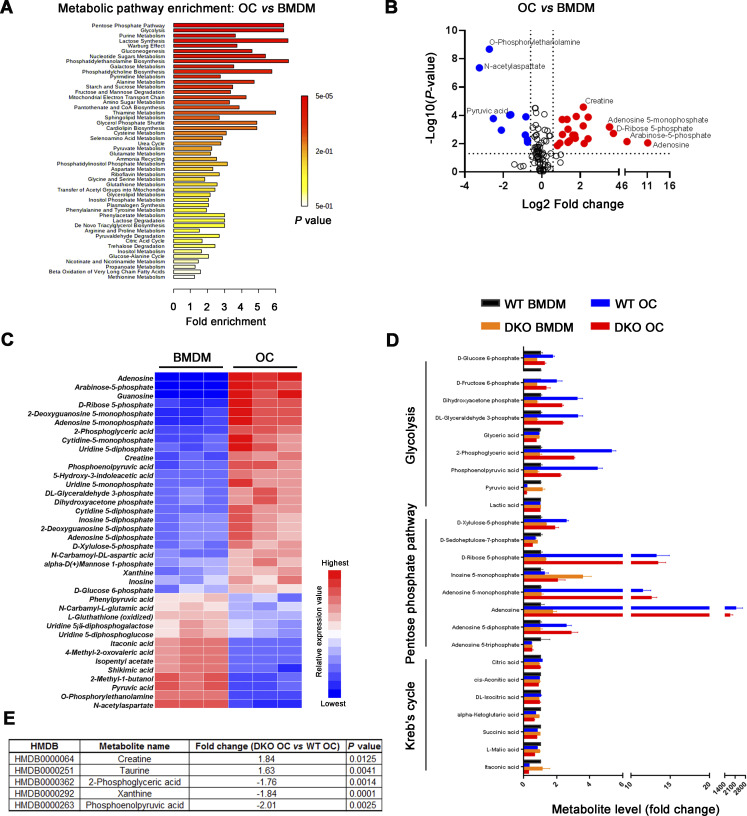
Figure S2.
Identification and quantitative analysis of the metabolome in Mmp9/Mmp14 DKO osteoclasts. (A and B) MetaboAnalyst analysis (A) and volcano plots (B) of differentially expressed metabolites from wild-type osteoclasts versus BMDMs (n = 3 biological replicates). (C) Heat map representation of metabolomics profile data highlights differentially expressed metabolites from wild-type osteoclasts (OC) versus BMDMs (n = 3 biological replicates; color bar, relative expression value). (D) Relative abundance of key metabolites from pentose phosphate pathway, glycolysis, and Kreb’s cycle in BMDMs and osteoclasts generated from wild-type or DKO mice. Data are presented as mean ± SEM (n = 3 biological replicates). (E) Lists of five differentially expressed metabolites from DKO osteoclasts versus wild-type osteoclasts (n = 3 biological replicates). Statistical significance was assessed using unpaired two-sided Student’s t test.

