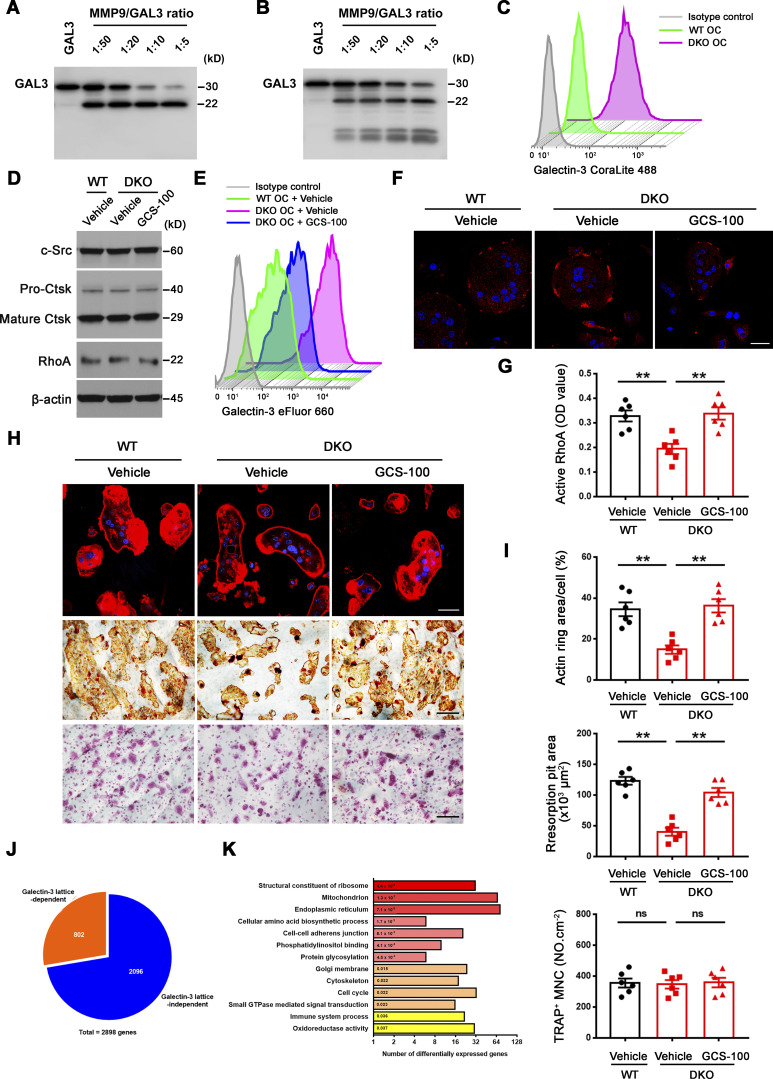
Figure S4.
Galectin-3 surface binding antagonist reverses functional defects in DKO osteoclasts. (A and B) Galectin-3 cleavage by Western blot using either an anti–galectin-3 full-length polyclonal antibody (Proteintech, 14979-1-AP; A) or an anti–galectin-3 monoclonal antibody (ab2785; Abcam; epitope mapped within the N-terminal region; B), following co-incubation with 3 μg recombinant human GALECTIN-3 and activated recombinant MMP9 at molar ratios from 1:50 to 1:5 (enzyme to substrate ratio) at 37°C for 30 min. Results are representative of three independent experiments. (C) Detection of surface galectin-3 in wild-type and DKO osteoclasts (OC) with the CoraLite 488–conjugated galectin-3 full-length polyclonal antibody (CL488-14979; Proteintech) as detected by flow cytometry. Results are representative of three independent experiments. (D) c-Src, Ctsk, and RhoA expression in wild-type osteoclasts differentiated and treated with vehicle, and DKO osteoclasts treated with vehicle or 20 μg/ml GCS-100 for 5 d at 37°C as assessed by Western blot. Results are representative of three independent experiments. (E and F) Surface galectin-3 levels were determined in wild-type osteoclasts treated with vehicle, and DKO osteoclasts treated with vehicle or 20 μg/ml GCS-100 for 2 h at 37°C, followed by flow cytometry stained with an eFluor 660–conjugated anti–galectin-3 monoclonal antibody (#50-5301-82; Thermo Fisher Scientific; clone M3/38, epitope mapped within the N-terminal region; E) or immunofluorescence stained with an anti–galectin-3 monoclonal antibody (#125401; Biolegend; clone M3/38; F; red). Scale bar, 20 μm. Results are representative of three independent experiments. (G) Wild-type osteoclasts were treated with vehicle, and DKO osteoclasts were treated with vehicle or 20 μg/ml GCS-100 for 2 h at 37°C, and RhoA activity determined following activation with 20 ng/ml M-CSF and 30 ng/ml RANKL for 15 min. Data are presented as mean ± SEM (n = 6 biological replicates). (H and I) Phalloidin staining (red), resorption pits visualized with WGA-DAB staining, and TRAP staining in wild-type pre-osteoclasts treated with vehicle, and DKO pre-osteoclasts treated with vehicle or 20 μg/ml GCS-100 cultured on bone slices for 3 d at 37°C (H) with actin ring area per cell, resorption pit area, and the number of TRAP+ MNCs quantified (I). Scale bar, upper 20 μm, middle and lower 100 μm. Data are presented as mean ± SEM (n = 6 biological replicates). (J and K) Transcriptional profiling analysis of cultured wild-type osteoclasts treated with vehicle, and DKO osteoclasts differentiated and treated with vehicle or 20 μg/ml GCS-100 for 5 d at 37°C (n = 3 biological replicates). Pie chart depicts the distribution of reversed transcripts by GCS-100 in DKO osteoclasts as compared with wild-type osteoclasts (J; n = 3 biological replicates). DAVID GO analysis of reversed expressed genes from DKO osteoclasts treated with GCS-100 versus DKO osteoclasts (K; n = 3 biological replicates). **P < 0.01. Statistical significance was assessed using one-way ANOVA with Bonferroni correction. Source data are available for this figure: SourceData FS4.

