Figure 1.
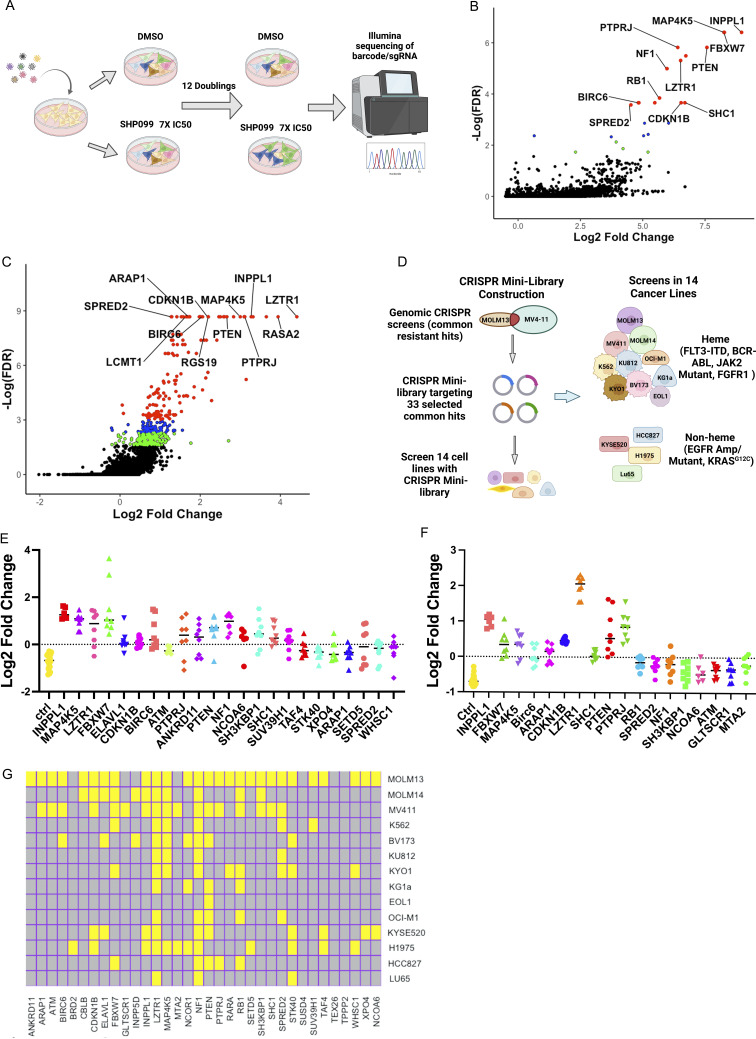
CRISPR screens for SHP099 resistance. (A) Workflow for genome-wide CRISPR KO screens. (B and C) Results of genome-wide CRISPR KO screens of MOLM13 (B) and MV4-11 (C) cells, analyzed by MaGeCK; red circles indicate enriched genes with FDR < 0.05, blue circles label enriched genes with 0.05 < FDR < 0.1, and green circles show genes with 0.1 < FDR < 0.2. (D) Workflow for focused CRISPR mini-screens of 14 cancer lines. (E and F) Results of CRISPR mini-screens of MOLM13 (E) and MV4-11 (F) cells. Points represent log2-fold enrichment (SHP099 vs. DMSO) of each sgRNA present in the library targeting the indicated gene compared with non-targeting (ctrl) sgRNAs; significance was assessed by Student’s t test with FDR correction. (G) Heat map showing significant hits in CRISPR mini-screens across 14 cancer lines. Yellow color indicates FDR < 0.05 enrichment for a given gene in a cell line.

