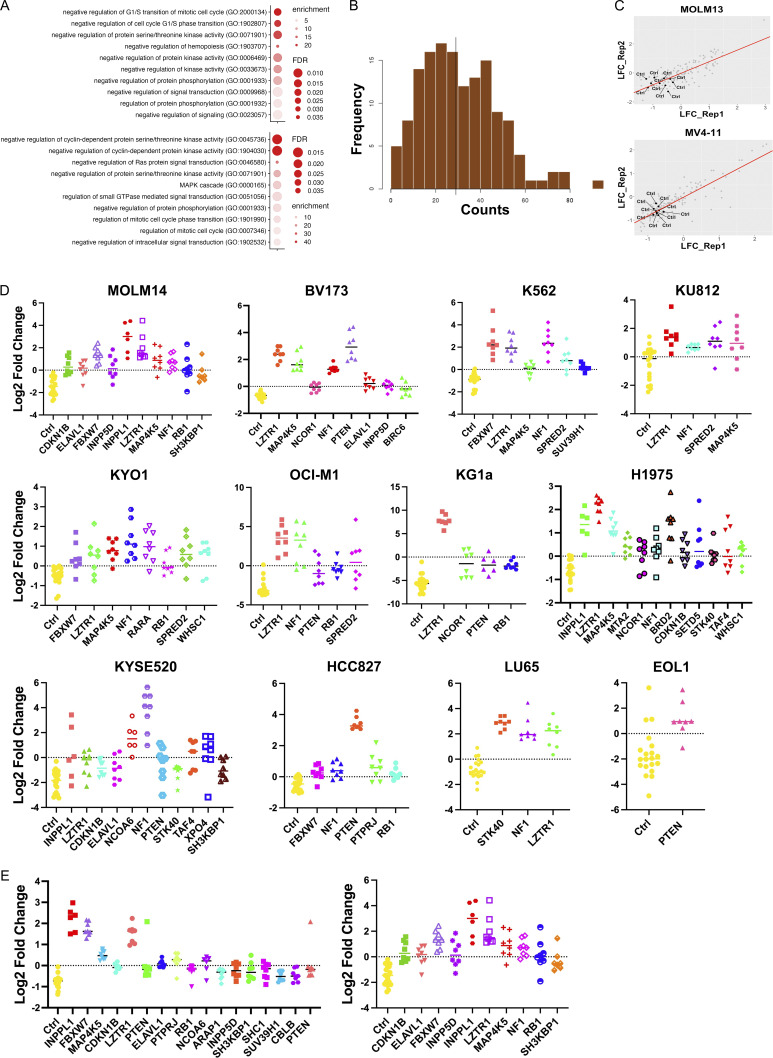
Figure S1.
Focused CRISPR mini-screens identify genes conferring SHP099 resistance in 12 additional cell lines. (A) GO analysis of top 50 resistance genes from genome-wide MOLM13 (top panel) and MV4-11 (bottom panel) screens. Select pathways (colored red in Table S2) are shown. (B) sgRNA distribution in cloned CRISPR mini-library: 141/142 sgRNAs were detected. (C) Correlation between replicate CRISPR mini-screens of MOLM13 and MV4-11 cells. Log2-fold enrichment of each sgRNA is shown for treatment (SHP099 at 7× IC50 for each line) vs. vehicle (DMSO) groups at screen termination. All non-targeting sgRNAs (Ctrl) were depleted as expected. (D) Significantly enriched genes (FDR < 0.05) in CRISPR mini-screens of the indicated cancer cell lines. (E) Effect of SHP099 concentration on recovery of resistance genes in MOLM14 cells. Left: 5× IC50 (3 µM). Right: 7× IC50 (5 µM).

