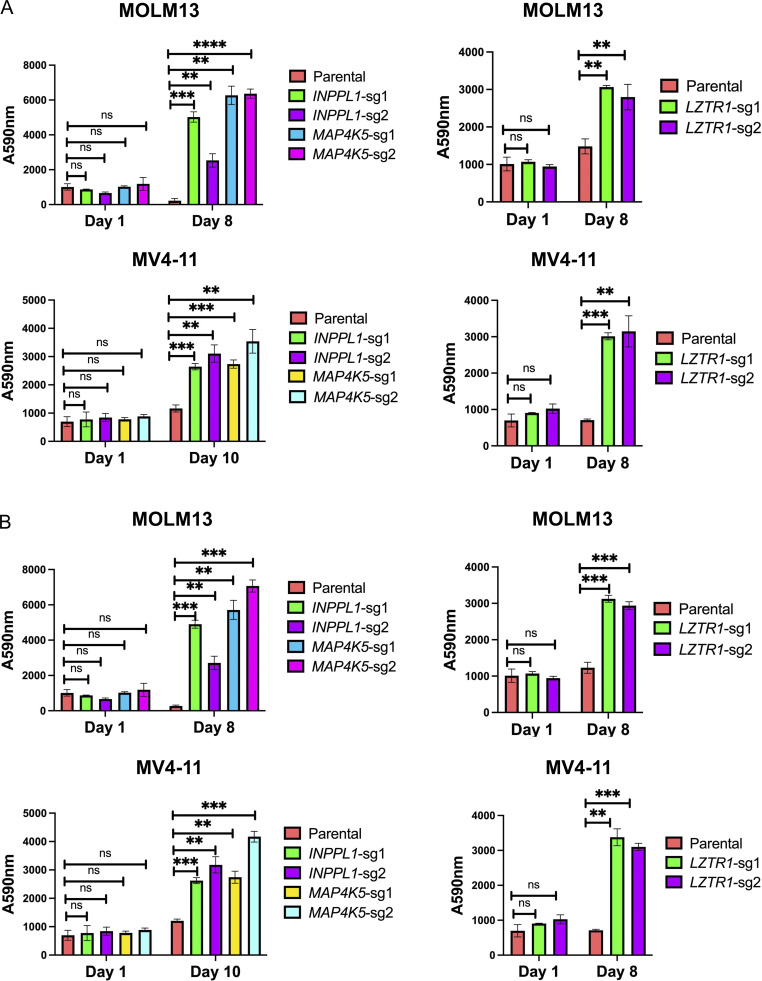
Figure S2.
INPPL1, MAP4K5, or LZTR1 KO confer resistance to other SHP2 inhibitors. (A) Top left: PrestoBlue assays on parental, INPPL1 KO, or MAP4K5 KO MOLM13 cells treated with RMC-4550 (60 nM). Top right: PrestoBlue assays on parental or LZTR1 KO cells treated with RMC-4550 (30 nM). Bottom left: PrestoBlue assays on parental, INPPL1 KO, or MAP4K5 KO MV4-11 cells treated with RMC-4550 (200 nM). Bottom right: PrestoBlue assays on parental or LZTR1 KO MV4-11 cells treated with RMC-4550 (300 nM). (B) Same design as in A, but with TNO155. Doses: 60 nM for parental and INPPL1 KO/MAP4K5 KO MOLM13 cells, 30 nM for parental and LZTR1 KO MOLM13 cells, 200 nM for parental and INPPL1 KO/MAP4K5 KO MV4-11 cells, or 300 nM for parental and LZTR1 KO cells. **, P < 0.01; ***, P < 0.001; ****, P < 0.0001.

