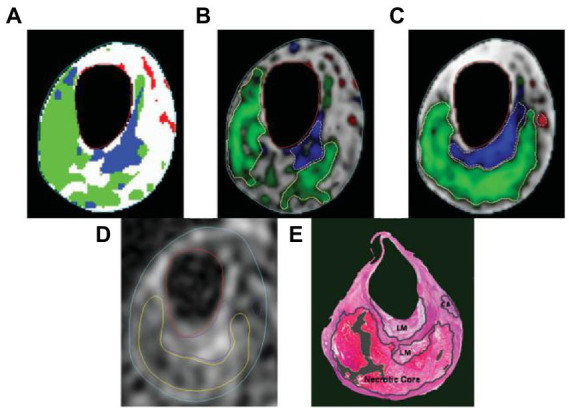
Figure 6.

The following segmentation results are displayed on a T2-weighted image. (A) Automatic labeling result by Gaussian classifier. (B) Probability map and region contours based only on intensity, with a necrotic core in green, calcification in a red, loose matrix in blue, and fibrous tissue in gray. (C) Corresponding results with morphologic information. (D) Manual segmentation result. (E) Corresponding histology specimen used to direct contour placement in (D) dark areas.
