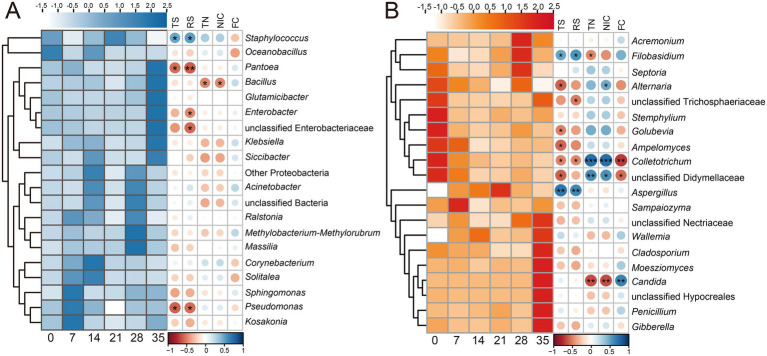
Figure 3.
Heatmaps showing the succession of Top20 genera and the correlations between each genus and fermentation indicators during cigar fermentation. (A) Bacteria; (B) fungi. The relative abundance of each microbial genus was normalized using Z-score. Succession in microbial genera is shown on the left, color is positively correlated with relative abundance. The right side shows the Spearman correlation between each genus and fermentation indicators, the correlation coefficient is represented by the color and size of the circles, dark blue indicates positive correlation, and dark red indicates negative correlation. *p < 0.05; **p < 0.01; ***p < 0.001. TS, total sugar; RS, reducing sugar; TN, total nitrogen; NIC, alkaloid. The numbers 0, 7, 14, 21, 28, 35 indicated the fermentation days.

