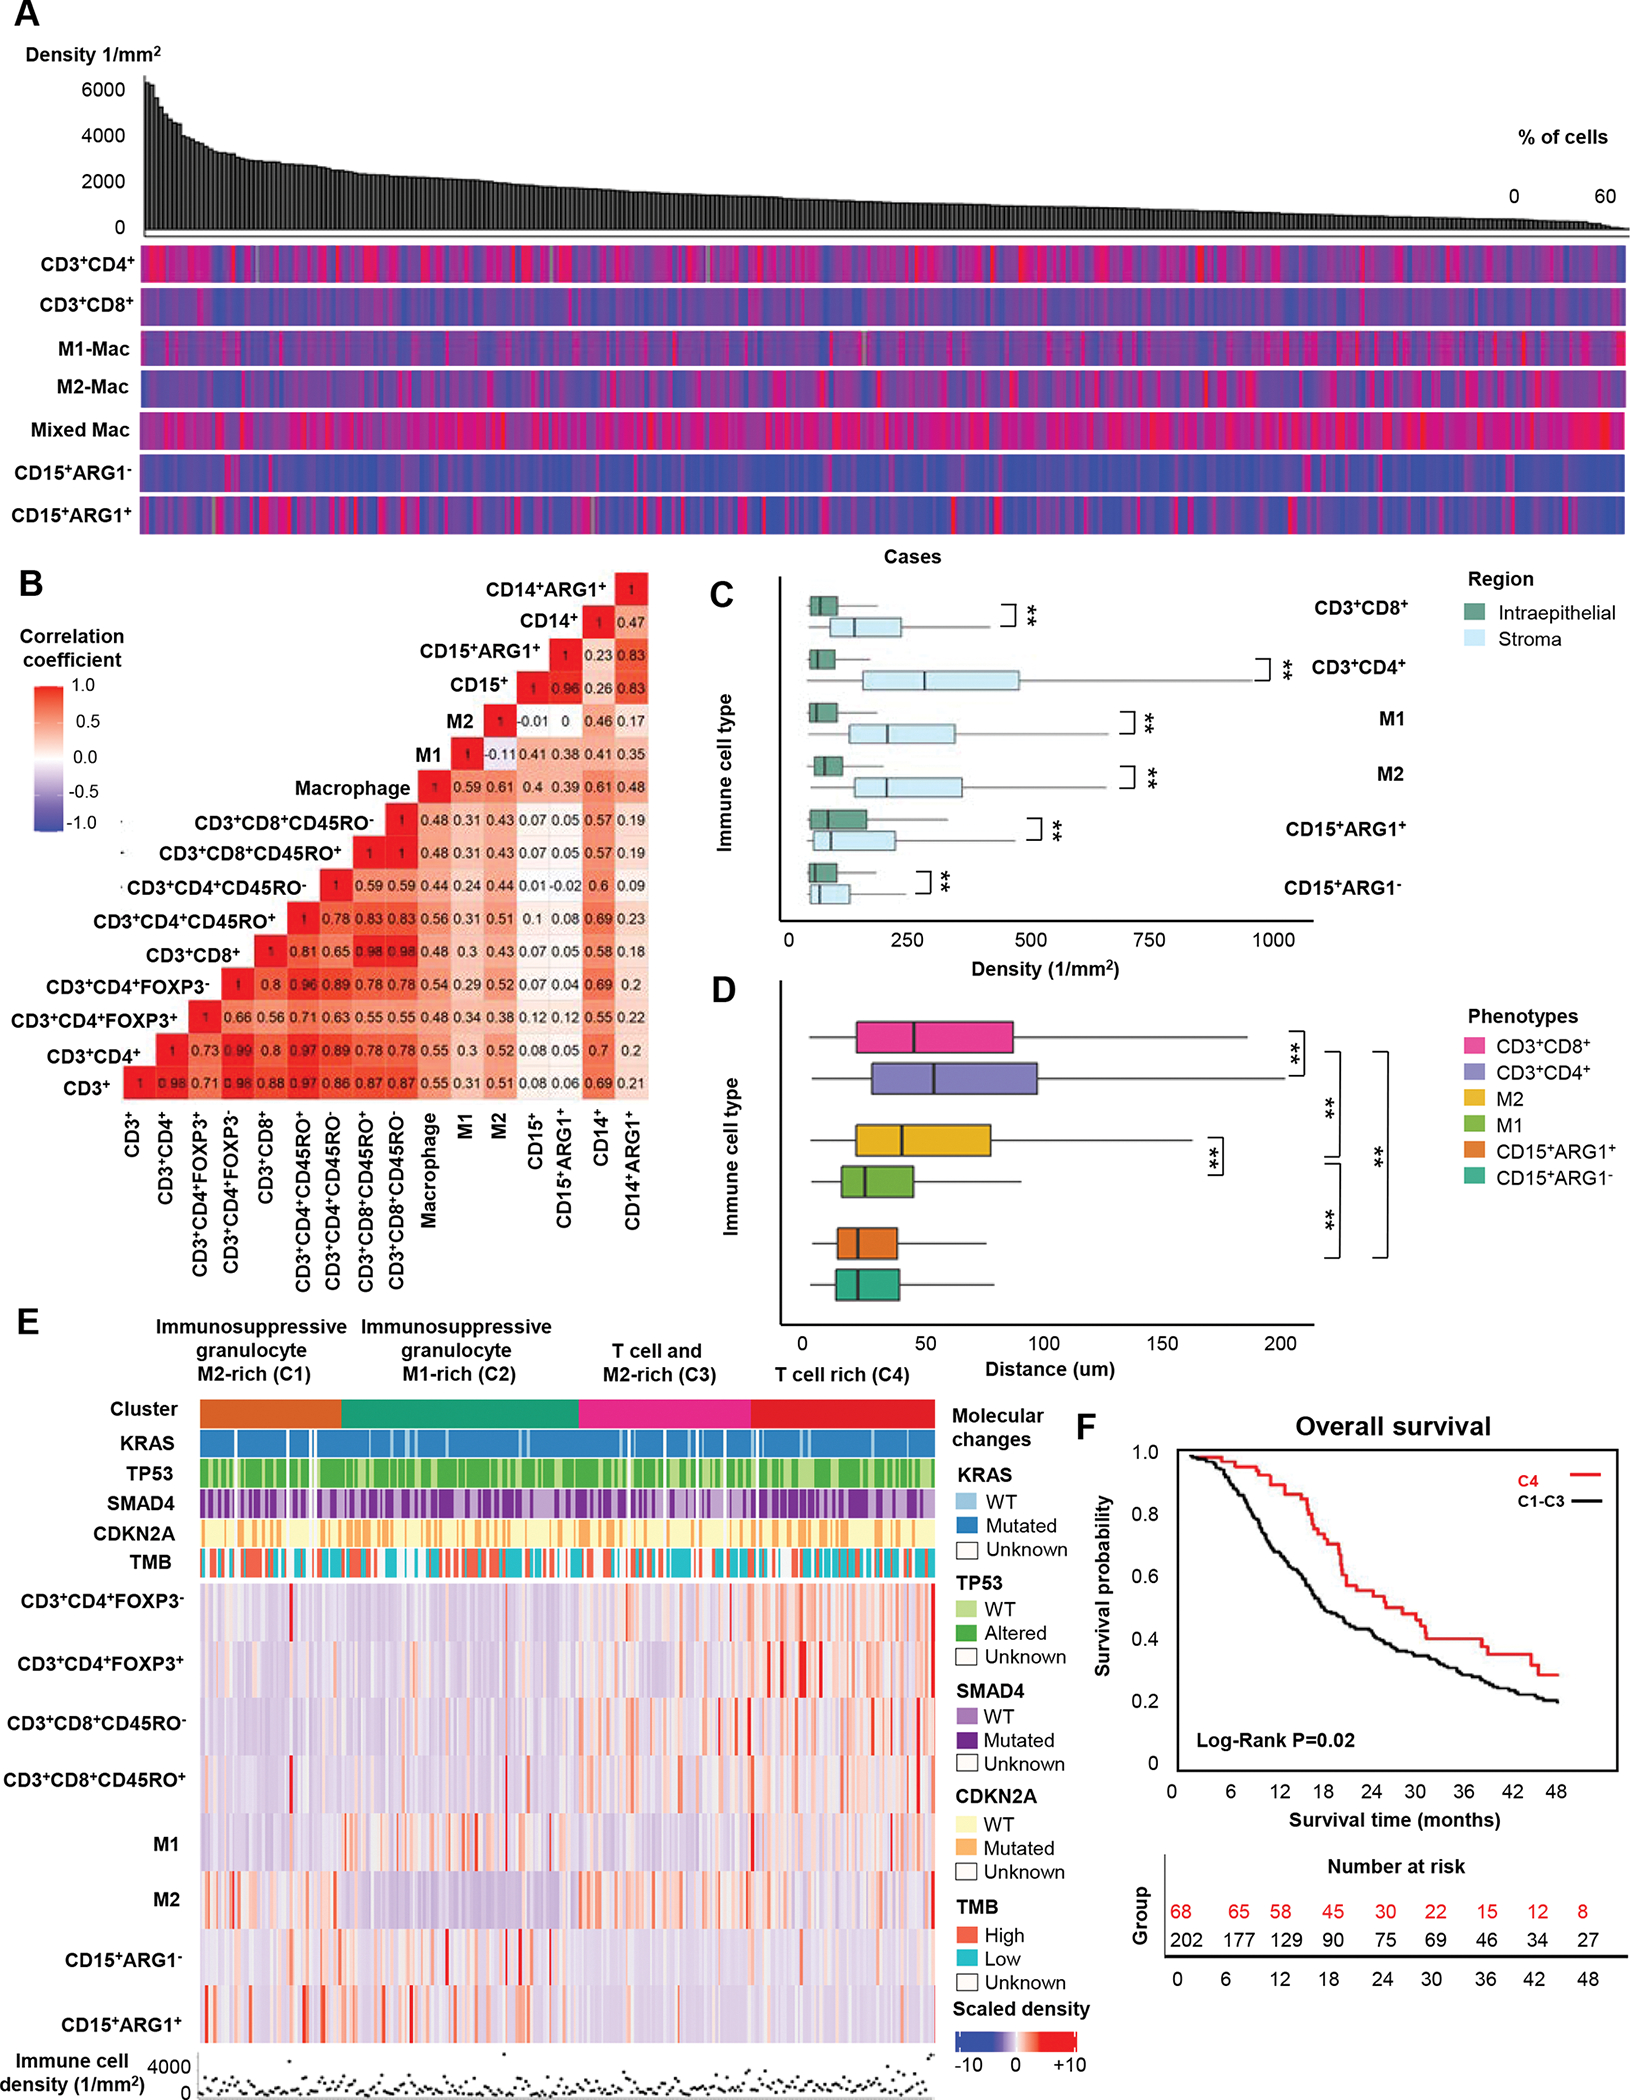
Figure 2. Immune cell landscape in up-front resected pancreatic ductal adenocarcinoma (PDAC).

Immune cell distributions across 270 PDACs organized by decreasing total cell density (top grey bar plot). Heatmaps display the relative distributions (0–100%) of the non-overlapping immune cell populations within the total cell count. Subsets included in this analysis are displayed on the left. Macrophages with minimal polarization towards M1- or M2-phenotypes are classified as mixed (A). Spearman correlation coefficients for densities of major immune cell types and subtypes (B). Immune cell densities in tumor intraepithelial and stromal regions (C). Boxplots depicting distances between individual immune cells and the closest tumor cell based on a total of 886,315 immune cells (D). Unsupervised k-means clustering analysis of immune cell densities and their associations with the four main PDAC genetic alterations and tumor mutational burden (E). Kaplan-Meier survival curves comparing the T cell-rich cluster (C4) to a combined group of clusters C1-C3 (F). P values were calculated with the Wilcoxon rank-sum test and Kruskal-Wallis test. ** P <0.005
