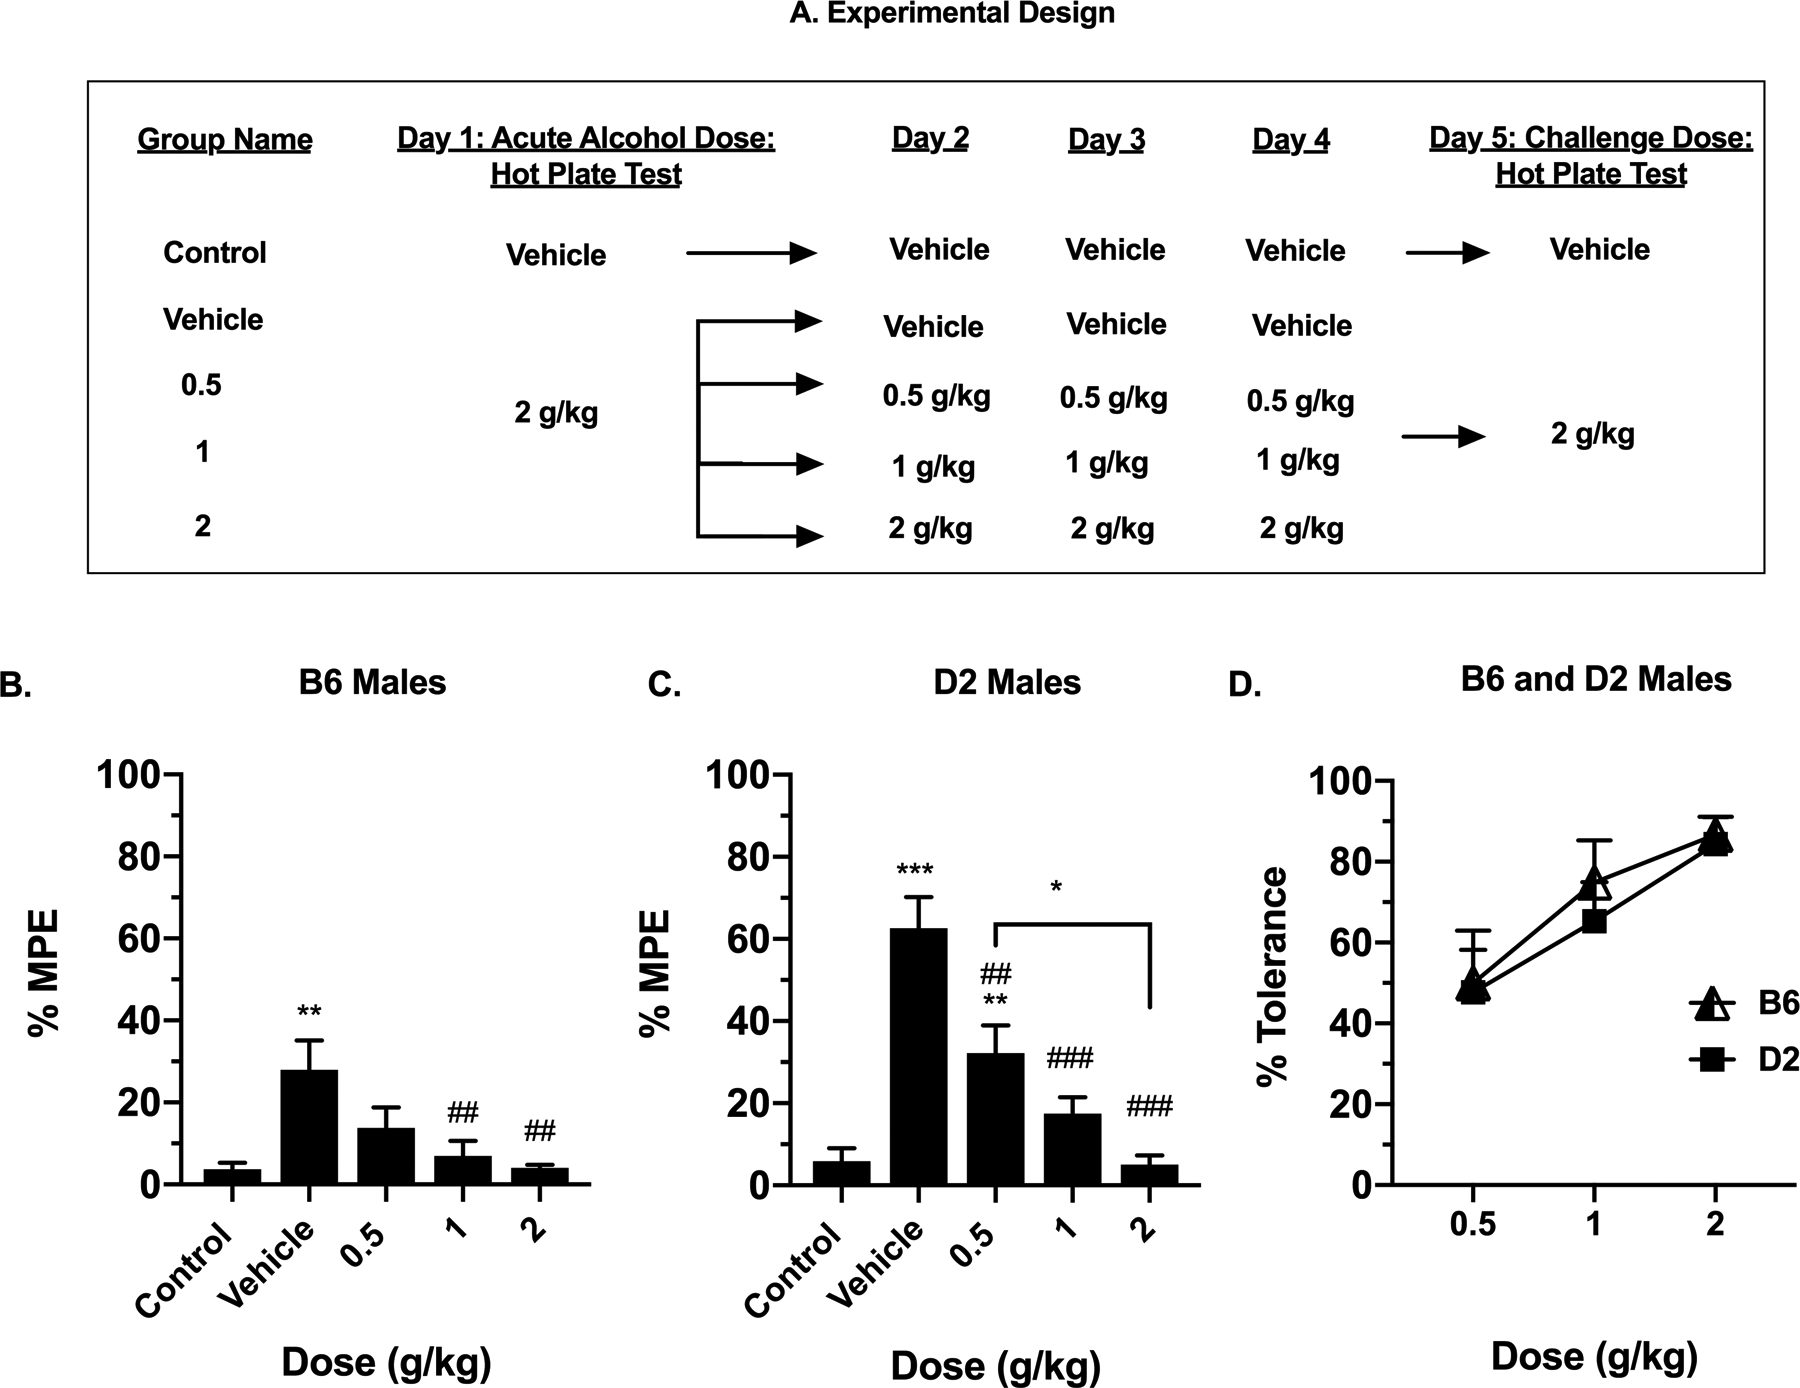
Figure 3. The Development of Tolerance to Alcohol’s Antinociceptive Effects After Repeated Exposure.

(A) Visual depiction of the experimental design for repeated alcohol exposure. Antinociception effect of alcohol after repeated oral administration, measured by the hot plate test as expressed by %MPE (Maximum possible effect), at different maintenance doses, 0.5, 1 and 2 g/kg, 30 min after alcohol gavage in (B) B6 male mice and (C) D2 male mice. Values are expressed as mean ± SEM. n= 8/group. Results were compared using a one-way ANOVA, followed by a post-hoc Dunnett’s test (*: p<0.05, **: p<0.01 and ***: p<0.001 vs. control) (#: p<0.05, ##: p<0.01 and ###: p<0.001 vs. vehicle). (D) The percent of tolerance measured by dose in B6 and D2 male mice.
