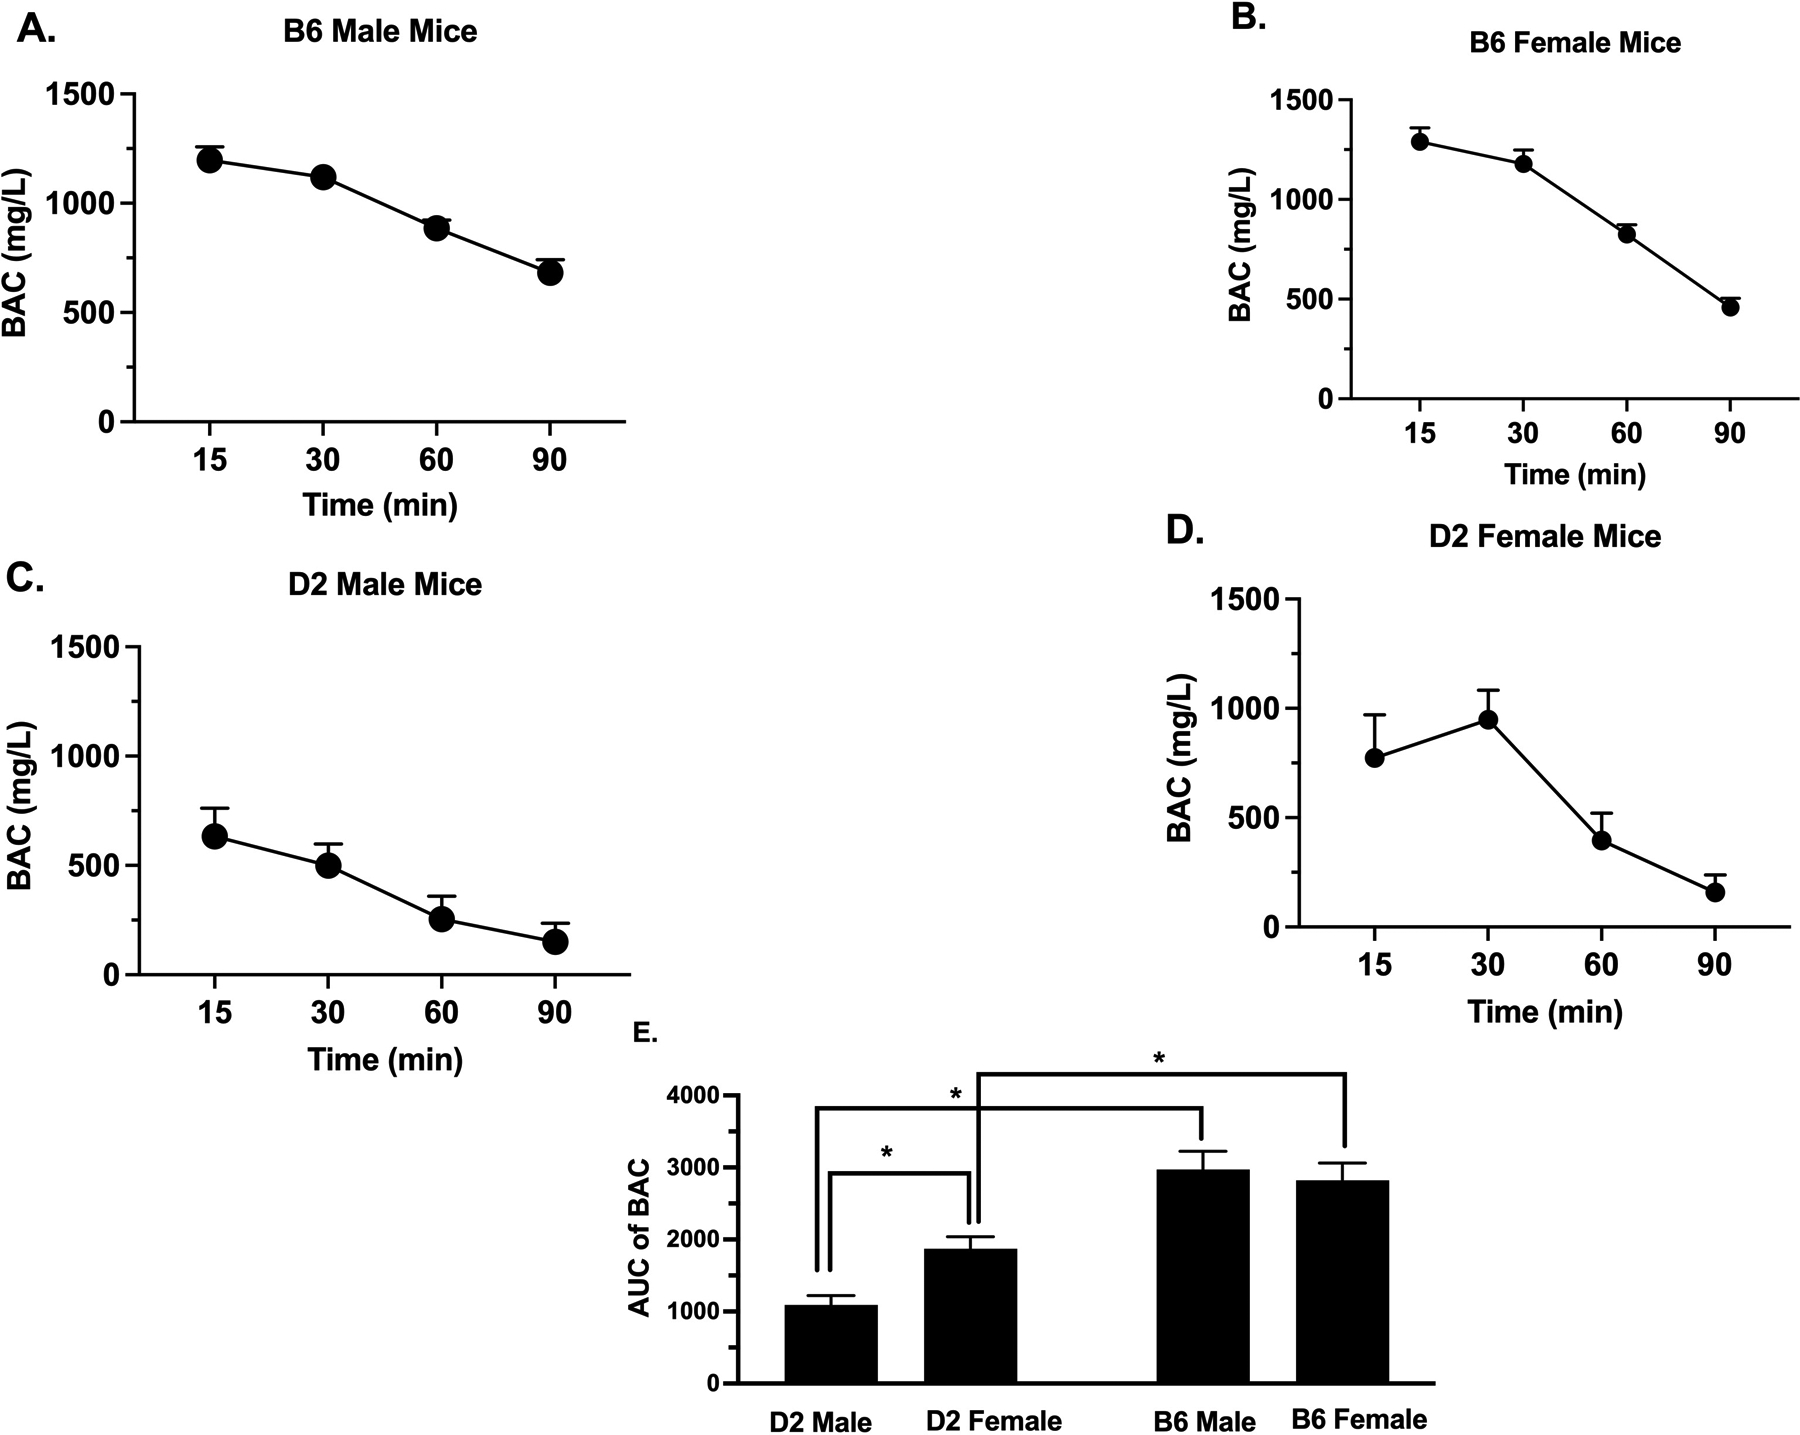
Figure 5. Blood Alcohol Concentration (BAC) Time-Course After Alcohol Administration.

BAC (mg/L) in (A) B6 male, (B) B6 female, (C) D2 male and (D) D2 female mice at various time points, 15, 30, 60 and 90 min after oral gavage of 2 g/kg alcohol. Values are expressed as mean ± SEM. n= 10/group. E) Comparison of the AUC of time-course of BAC in all mice (Results were compared using two-way ANOVA with sex and strain as a factor and post-hoc Sidak’s test) (*p<0.05).
