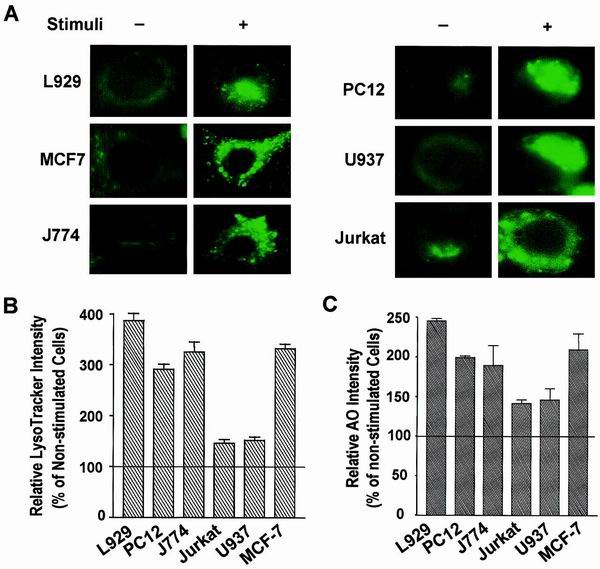
FIG. 8.
Lysosomal response in different models of cell death. Several different cell culture systems were used to evaluate the change in VAC during the cell death process. L929 and MCF-7 cells were treated with TNF (100 ng/ml) for 8 h; PC12 cells were serum deprived for 6 days; J774 cells were treated with oxidized LDL (100 μg/ml) for 3 days; Jurkat cells were treated with Fas antibody (0.5 μg/ml) for 3 h; and U937 cells were treated with ceramide (100 μM) for 4 h. (A) Lysosomes were stained with LysoTracker and morphologically analyzed by fluorescence microscopy. (B and C) VAC was measured using LysoTracker staining (B) or AO staining (C). The relative LysoTracker or AO intensity is expressed as percent change from the control and was calculated by dividing the arbitrary fluorescence intensity unit number by that of corresponding untreated samples.

