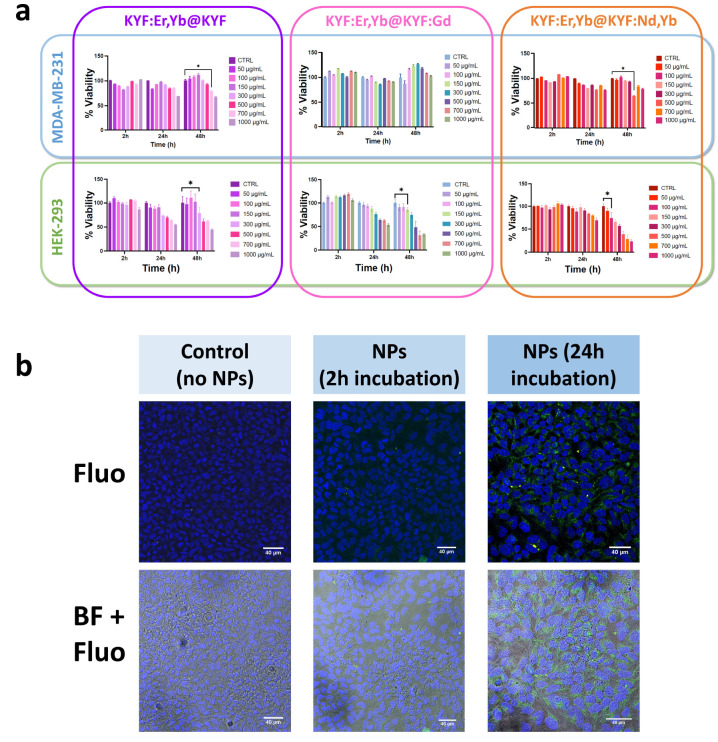
Figure 6.
(a) MTT assay results for two human cell lines (one healthy and one tumoral). Cell cultures have been incubated with different concentrations of NPs and vitality tests have been performed after 2, 24, and 48 h. For each graph, the * indicates the first significative concentration, which resulted to be toxic to the cell line. (b) Confocal images of control (nontreated) HEK cells and HEK cells incubated with KYF:Er,Yb@KYF:Gd NPs after 2 and 24 h of treatment, under diode laser excitation at 405 nm for Hoechst (blue region 410–460 nm) and a 514 nm laser diode for NPs (green 520–590 nm).

