Figure 7.
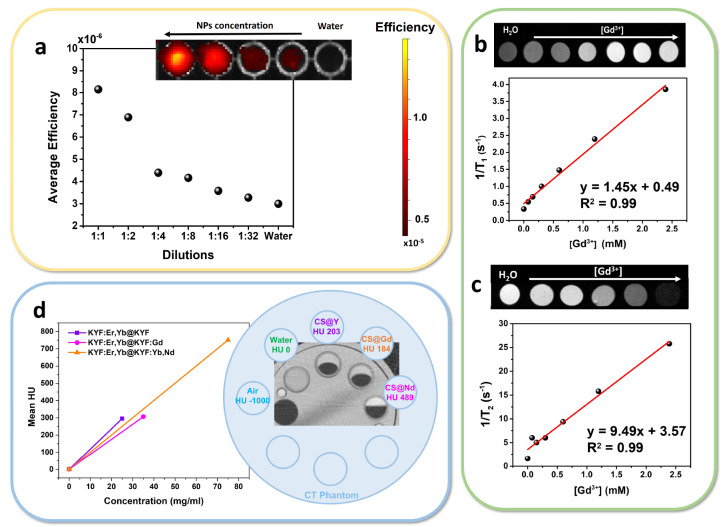
(a) Optical imaging efficiency of the KYF:Er,Yb@KYF:Nd,Yb NPs dispersions in the NIR range (1:1 dilution corresponds to 50 mg mL–1). (b and c) Evaluation of core@shell Gd3+-doped KY3F10 performance for MRI. Inverse of the longitudinal T1 and transverse T2 relaxation times vs the Gd3+ concentration. Linear fit for relaxivity determination: red line. Slopes of the fit: (b) r1 and (c) r2 relaxation rate constants. (d) Image: X-ray attenuation of KYF core@shell nanoparticles dispersions in a suitable phantom. Graph: interpolation of the X-ray attenuation vs nanoparticles concentration at 40 kVp (the line is a guide for the eye).

