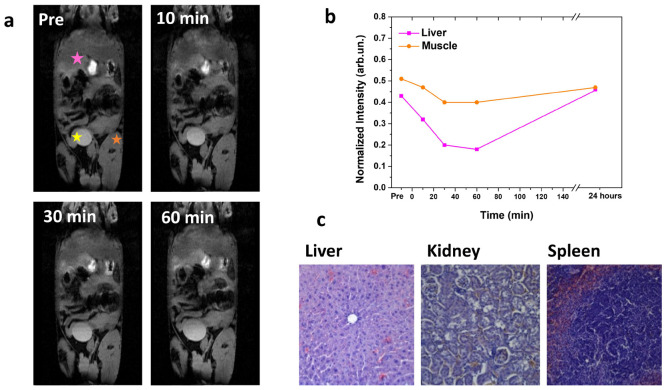
Figure 9.
(a) In vivo MRI a representative animal acquired using a T2-weighted sequence before (t = 0) and 10 min, 30 min, and 1 h after injection of NPs dispersion. (b) T2-weighted signal intensity in the liver is quantitatively compared to the signal in muscle. Intensities have been normalized using a reference sample. (c) Hematoxylin and eosin staining of liver, kidney and spleen, taken 72 h after the administration of NPs, under 10× magnification with an optical microscope in bright field mode.

