Figure 4.
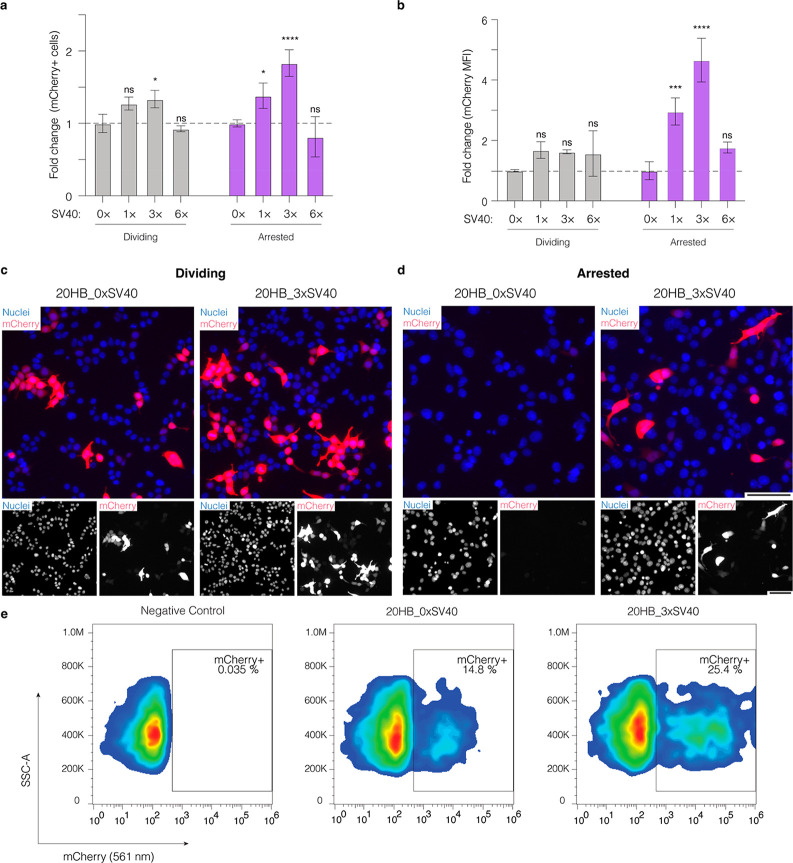
Presence of SV40 DTS sequences in DNA origami enhances gene expression through nuclear import. (a) Fold change of the percentage of mCherry+ cells and (b) mean fluorescence intensity (MFI) of mCherry in dividing and arrested cells after electroporation with 20HB variants. Both the percentage of mCherry positive cells and MFI are shown as fold change compared to the value of the control 20HB_0×SV40 in dividing and arrested cells, respectively. Data collected in (a) and (b) were quantified using flow cytometry and are presented as mean ± standard deviation (s.d.) for n = 3 biologically independent experiments. Statistical analysis was performed using two-way ANOVA with Dunnett’s multiple comparisons (*p ≤ 0.05, ***p ≤ 0.001, ****p ≤ 0.0001, ns p > 0.05). Representative epifluorescence microscopy images after electroporation of dividing cells (c) and arrested cells (d) for the control 20HB_0×SV40 and 20HB_3×SV40. Images were taken 24 h after electroporation and are representative of n = 3 biological replicates (similar results were observed each time); the full panel including all conditions is given in Figure S7. In overlay, mCherry signal is shown in red, nuclei are shown in blue. Scale bar is 100 μm. (e) Representative flow cytometry gates demonstrating mCherry expression (mCherry 561 nm, x-axis) against side scatter-area (SSC-A, y-axis) in chemically arrested HEK293T cells.

