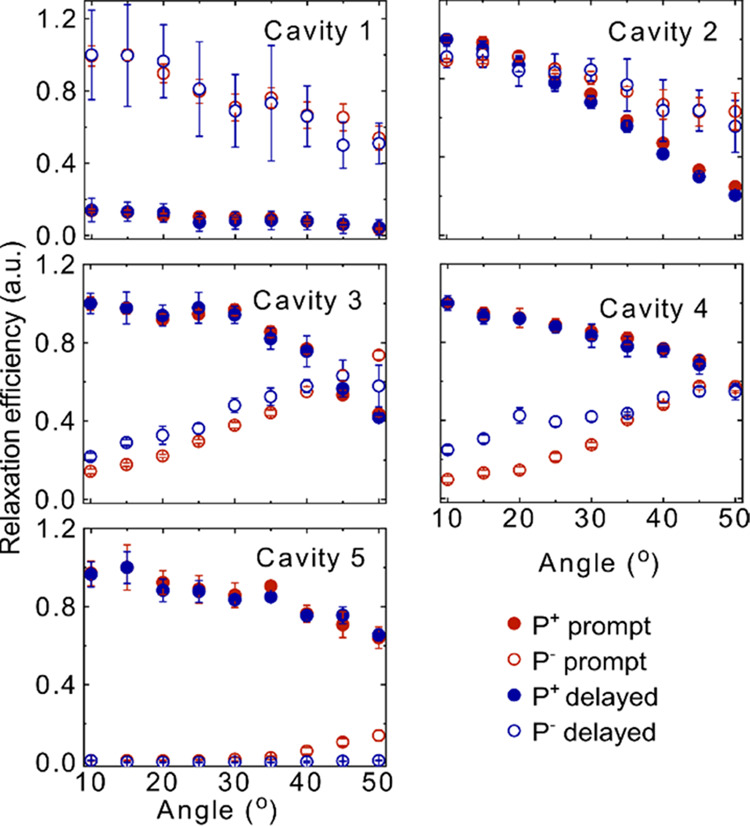
Figure 4.

Relative relaxation efficiency of the upper and lower polariton branches of all of the cavities. The red closed and open circles represent the efficiency in the prompt regime and the blue closed and open circles represent the efficiency in the delayed regime for P+ and P–, respectively. The data are normalized at the maximum efficiency. The error bars represent the standard deviation of the experimental result from the mean value.
