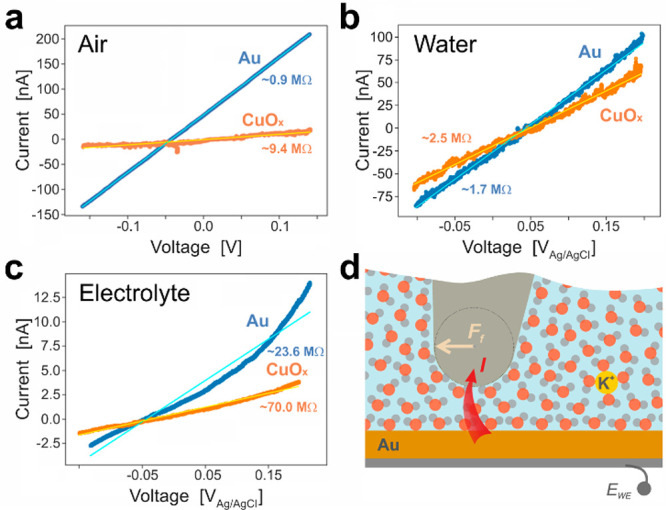
Figure 3.

(a) Representative I–V curves measured, in air, on Spot #1 (on CuOx, as marked in Figure 2a, orange) and on Au (blue). Results of linear fits to the data are given by solid lines (in orange and cyan, respectively). Representative I–V curves measured on CuOx and Au, in water are shown in (b) and in 100 mM KHCO3 electrolyte in (c). (d) Depiction of the water molecule ordering, for the case EWE > 0, in the vicinity of the catalyst and tip surfaces, as well as a K+ cation (in yellow). A friction force Ff is acting on the tip scanning from left to right.
