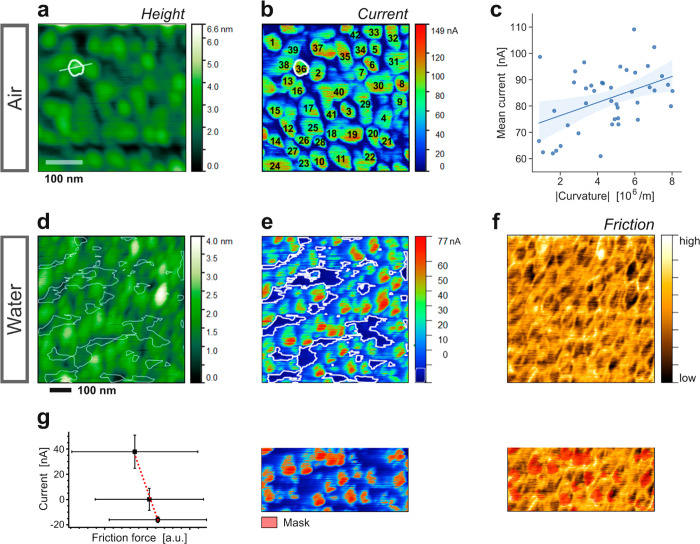
Figure 4.
c-AFM imaging of a polycrystalline Au electrocatalyst surface in air and in water. (a) Height image, recorded in air, with grain #36 and its cross-section for profile analysis marked with white lines. (b) Current image, measured in air at Ei ≈ +220 mV. (c) Plot of the mean current measured on individual grains versus the grain curvature. Solid blue line: linear trendline. (d) Height image of a polycrystalline Au surface, in water. (e) Current image, measured at Ei ≈ +340 mV vs Ag/AgCl. Thin white lines indicate low current regions. (f) Corresponding friction force image. (g) Panel illustrating the correlative analysis of current and friction force images by splitting the total current range into 3 regimes and evaluating the mean current and friction values for each regime. The resulting current vs friction plot is shown on the left. All images were obtained using TiN-coated tips.

