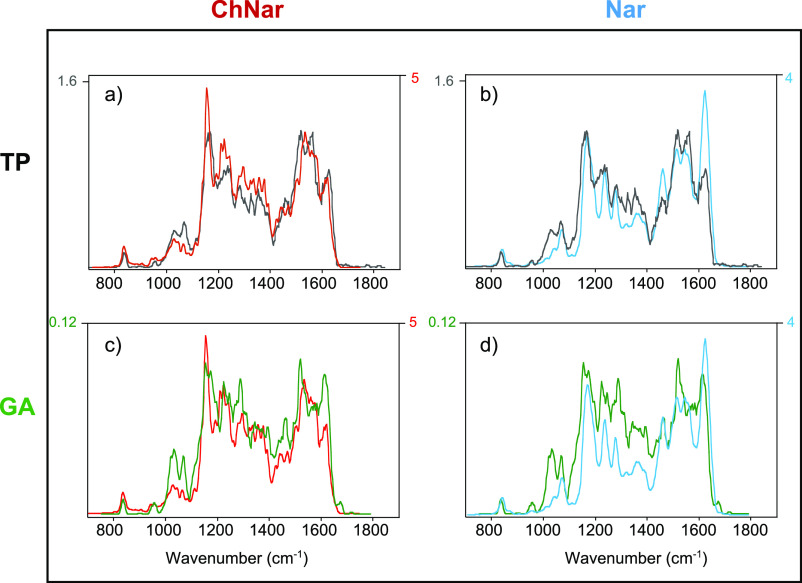
Figure 6.
Comparison between the IRMPD spectra of mass-selected ions at m/z 273 from (1) the methanolic extract of tomato peel (upper panel (a and b), black trace) and (2) the methanolic extract of grapefruit albedo (lower panel (c and d), green trace) with standard solution of naringenin chalcone (on the left (a and c), red trace) and of naringenin (on the right (b and d) light blue trace) recorded at higher energy.

