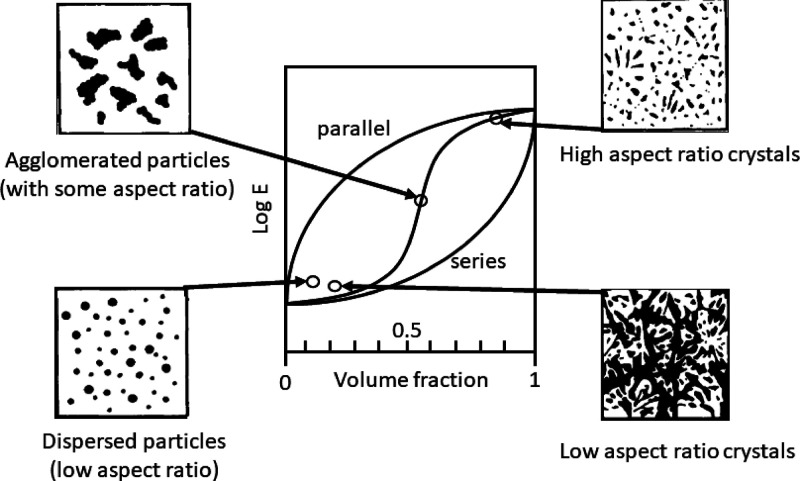
Figure 14.
Schematic of the parallel (upper bound) and series (lower bound) models of reinforcement indicating representations of the different morphologies that give rise to mechanical behavior bound by these two limits. The graph shows modulus (E; on a log scale) as a function of volume fraction. Modified from ref (142).

