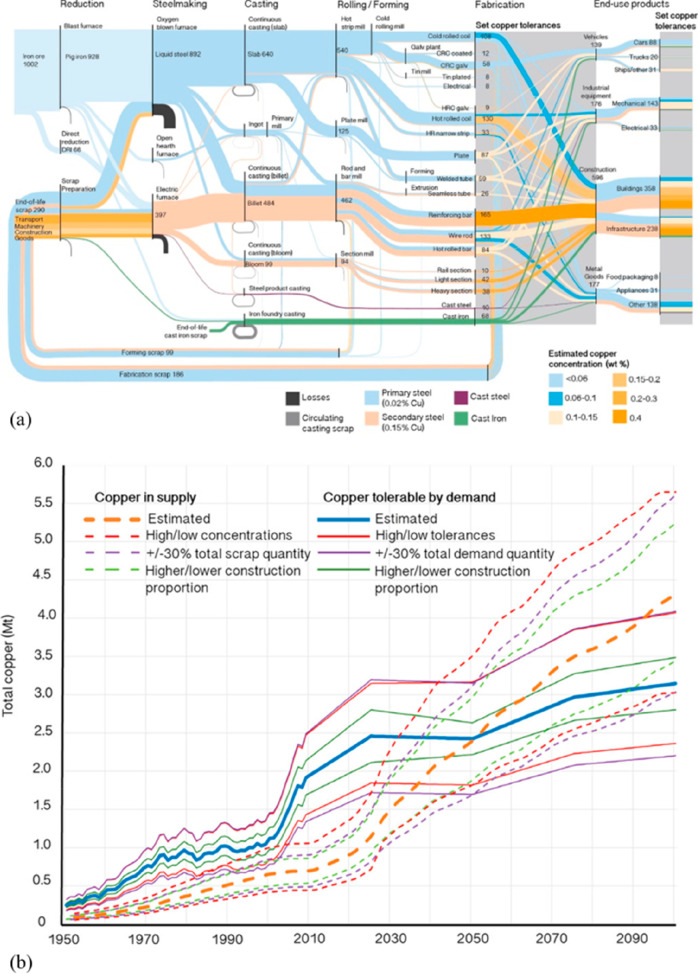
Figure 102.
(a) Daehn et al.10 developed a Sankey diagram for the global steel flows. The data are plotted in million tonnes, considering the estimated copper concentrations. The gray zones contain copper tolerance limits of intermediate products and of end-use products with the aim to compare copper in the system versus maximum tolerable amounts. (b) Amount of copper in the end-of-life scrap supply and copper tolerable by demanded products from 1950 to 2100. The figures are reproduced with permission from ref (10). Copyright 2017, under a Creative Commons Attribution (CC-BY) License.

