
Figure 44.
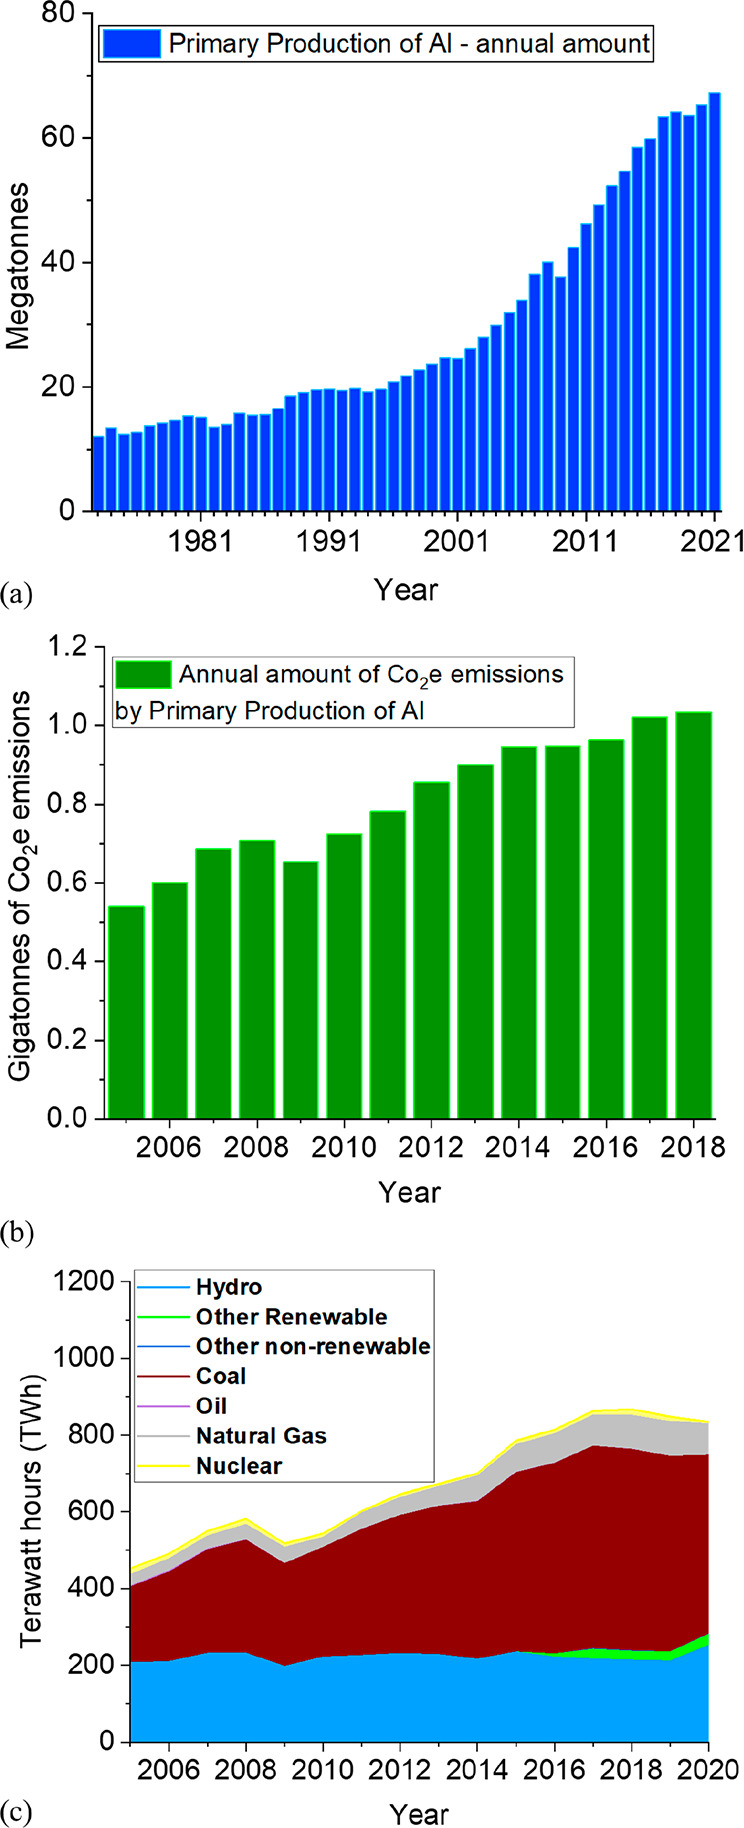
(a) Global amount of primary aluminum production in megatonnes (Mt) for the years 1973–2021.185 (b) Calculated global annual amount of CO2eq emissions emitted by primary production of aluminum in gigatonnes (Gt) for the years 2005–2018.185 (c) Global annual energy consumption for the primary production of aluminum with the origin of the energy sources given in terawatt hours (TWh).185 The figures are reproduced with permission from data of the International Aluminum Institute (IAI).185 Copyright 2022, International Aluminum Institute.