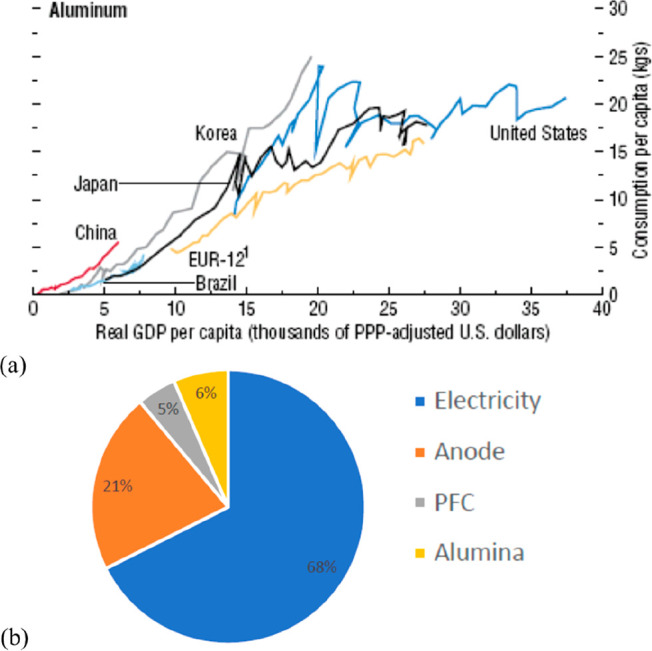
Figure 46.

(a) Global per capita consumption of aluminum. Data from IMF World Economic Outlook presented in ref (158). (b) CO2 emissions in aluminum production by source, also showing that the CO2 emissions associated with the source of electricity used is the main factor. The figure is reproduced with permission from ref (158). Copyright 2010, The Open University, Milton Keynes, U.K. PFC, perfluorocarbon emission. This legend entry refers to efforts that need to be taken to reduce the effects of PFC emissions due to anode effects.
