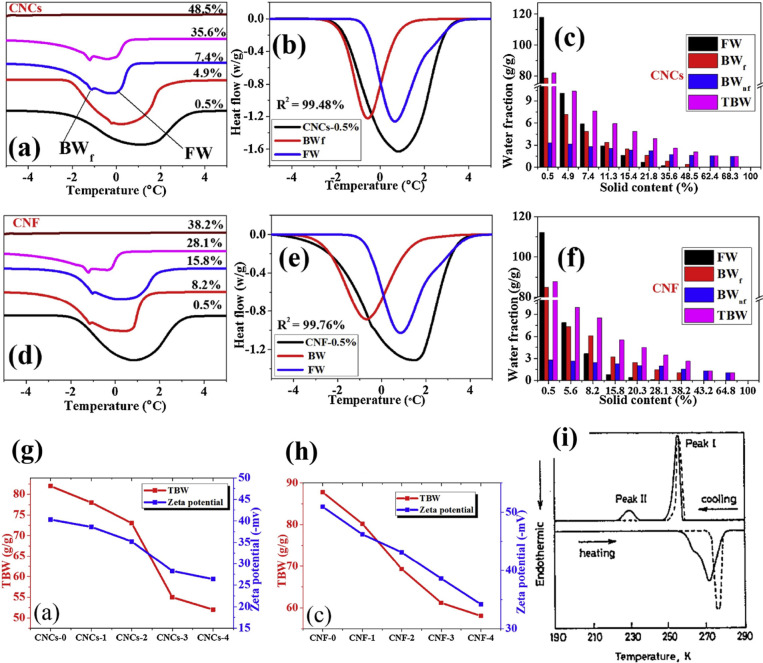
Figure 26.
Using DSC to uncover nanocellulose–water interactions. (a,d) Characteristic DSC melting curve for CNCs and CNF. (b,e) Split peak fitting curve of CNCs-0.5% and CNF-0.5%. (c,f) Distribution histograms of various water components in different solids of CNCs and CNF. FW, BWf, BWnf, and TBW stand for free water, freezing bound water, nonfreezing bound water, and total bound water, respectively.332 (g,h) TBW and zeta potential of redispersed nanocellulose dispersion after dehydration. (a–h) Adapted with permission from ref (332). Copyright 2019 Elsevier. (i) Schematic DSC curves of water on different cellulose samples: free water (peak I) and freezing bound water (peak II).272 (i) Adapted with permission from ref (272). Copyright 1981 Sage Publications.

