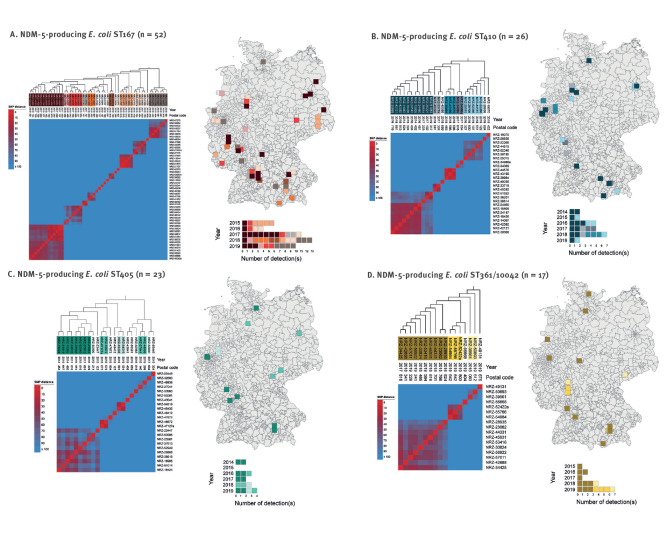
Figure 4.
Heatmaps of pairwise SNP differences between NDM-5-producing Escherichia coli isolates as well as spatial and temporal distribution of strains, Germany, 2013–2019
SNP: single nucleotide polymorphism.
Colours in the heatmap represent SNP numbers as shown in the legend on the left. Phylogenetic trees including the year and the three-digit postal code for the isolates are shown on top of the heatmap. Isolates from clonal clusters are colour-coded and mapped based on the three-digit postal code as well as shown by annual number of detections.

