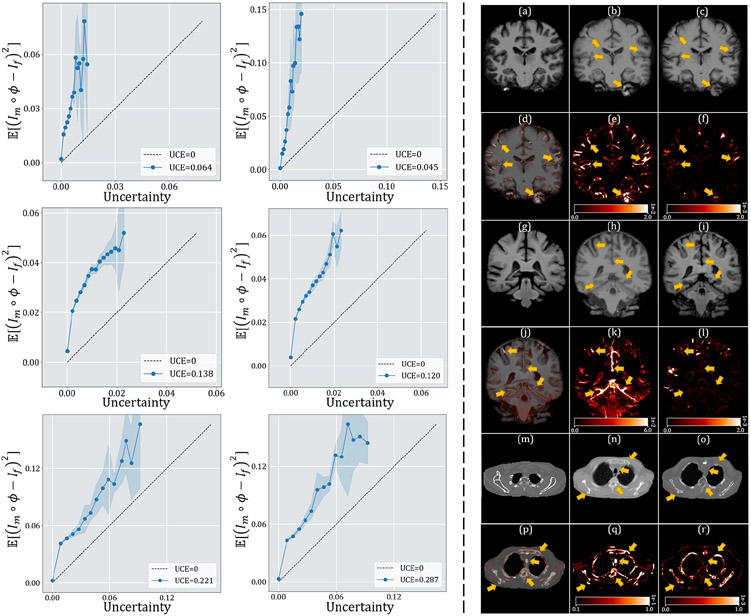
Fig. 14:
Comparisons of the appearance uncertainty estimates derived from the predictive variance and the predicted model error. Left panel: Calibration plots and uncertainty calibration error (UCE) for TransMorph-Bayes on two inter-patient brain MR test sets (top), two atlas-to-patient brain MR test sets (middle), and two XCAT-to-CT test sets (bottom). The blue lines represent the results obtained using the uncertainty estimate . The dashed lines represent the perfect calibration, which are the results achieved when the uncertainty estimate is or (i.e., the expected model error). The values are obtained from 10 repeated runs, and the shaded regions represent the standard deviation. Right panel: Visualization of the registration uncertainty on an inter-patient brain MRI test set (i.e., a-f), an atlas-to-patient brain MRI test set (i.e., g-l), and a CT test set (i.e., m-r). (a), (g), & (m): Moving image. (b), (h), & (n): Fixed image. (c), (i), & (o): Deformed moving image. (d), (j), & (p): Per-pixel uncertainty, represented by , overlays the deformed image. (e), (k), & (q): Per-pixel uncertainty given by (i.e., the proposed method). (f), (l), & (r): Per-pixel uncertainty given by . The yellow arrows highlight sites where identifies registration failures but does not.

