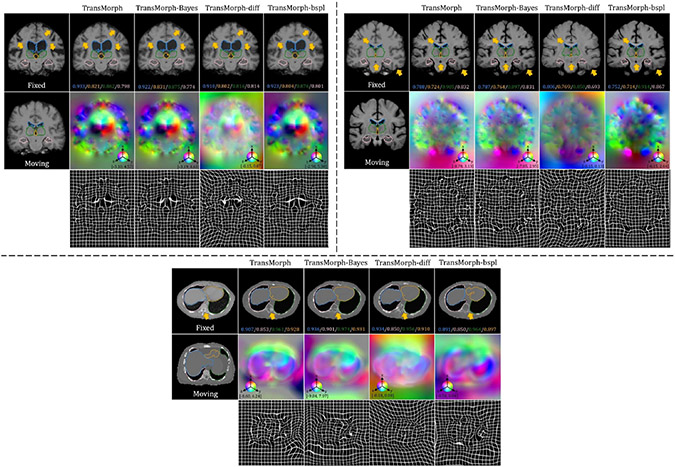
Fig. 8:
Qualitative results of TransMorph (2nd column) and its Bayesian- (3rd column), probabilistic- (4th column), and B-spline (5th column) variants. Top-left & Top-right panels: Results of inter-patient and atlas-to-patient brain MRI registration. The blue, orange, green, and pink contours define, respectively, the ventricles, third ventricle, thalami, and hippocampi. Bottom panel: Results of XCAT-to-CT registration. The blue, orange, green, and pink contours define, respectively, the liver, heart, left lung, and right lung. The second row in both panels exhibits the displacement fields , where spatial dimension x, y, and z is mapped to each of the RGB color channels, respectively. The [p, q] in color bars denotes the magnitude range of the fields.

