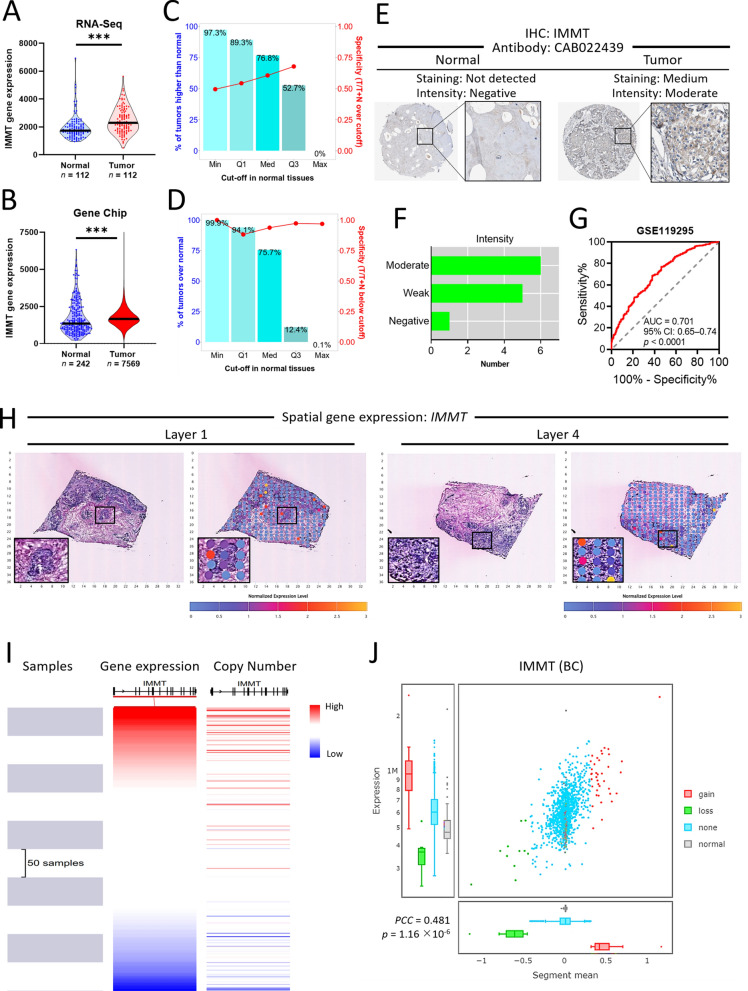
Fig. 2.
Differential expression and diagnostic value of IMMT. A and B violin plots showing the IMMT expression levels determined by RNA-seq (A) or gene chip (B) in normal and BC tumor tissues. ***p < 0.0001 between indicated groups. C and D the percent and specificity at various cut-off points in normal tissue from RNA-seq data (C) and gene chip data (D). E and F IHC staining for the detection of IMMT protein expression levels by antibody CAB022439 in normal and BC tissues (E). The number of BC patients (n = 11) determined with moderate, weak, or negative staining intensity. G ROC curves for normal and BC cohorts based on IMMT levels from the GSE119295 dataset. H Spatial IMMT expression in human BC tissue sections as determined by spatial transcriptomics. Black square enlarging the dark-staining tissue that indicates a tumor nest composed of hyperchromatic cancer cells. I and J the correlation of IMMT gene expression with its copy number. Heatmap analyzed o visualizing the expression-copy number relationship of GDC-TCGA Breast Cancer dataset (I). Pearson correlation coefficient (PCC) of tumors with IMMT copy number status of gain, loss, and none, and normal tissue based on TCGA breast cancer datasets

