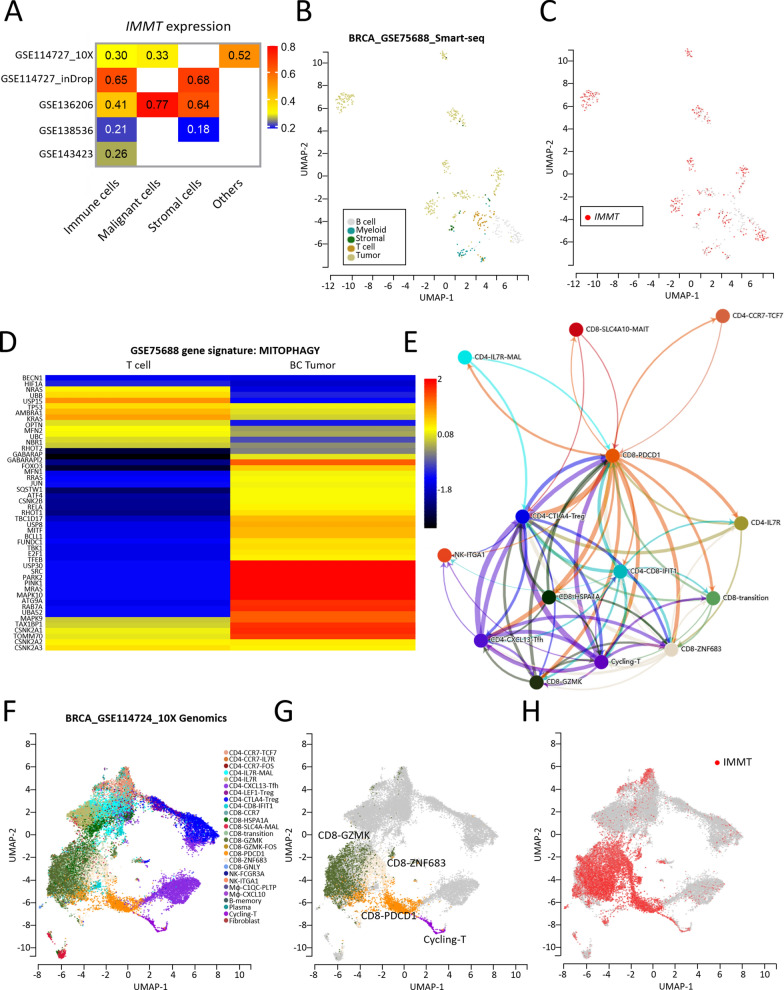
Fig. 5.
Analysis of IMMT at the single-cell level. A–H single-cell analysis. Heatmap showing the IMMT expression profile in immune cells, malignant cells, stromal cells and others of BC based on multiple GEO datasets (A). Uniform Manifold Approximation and Projection (UMAP) plots showing IMMT expression mapping on to different cell types in BC based on the GSE75688 dataset (B and C). Heatmap visualizing the gene signature MITOPHAGY of T cells and BC tumor (D). Communication network among immune cells (E). UMAP plots showing IMMT expression clusters (F–H)

