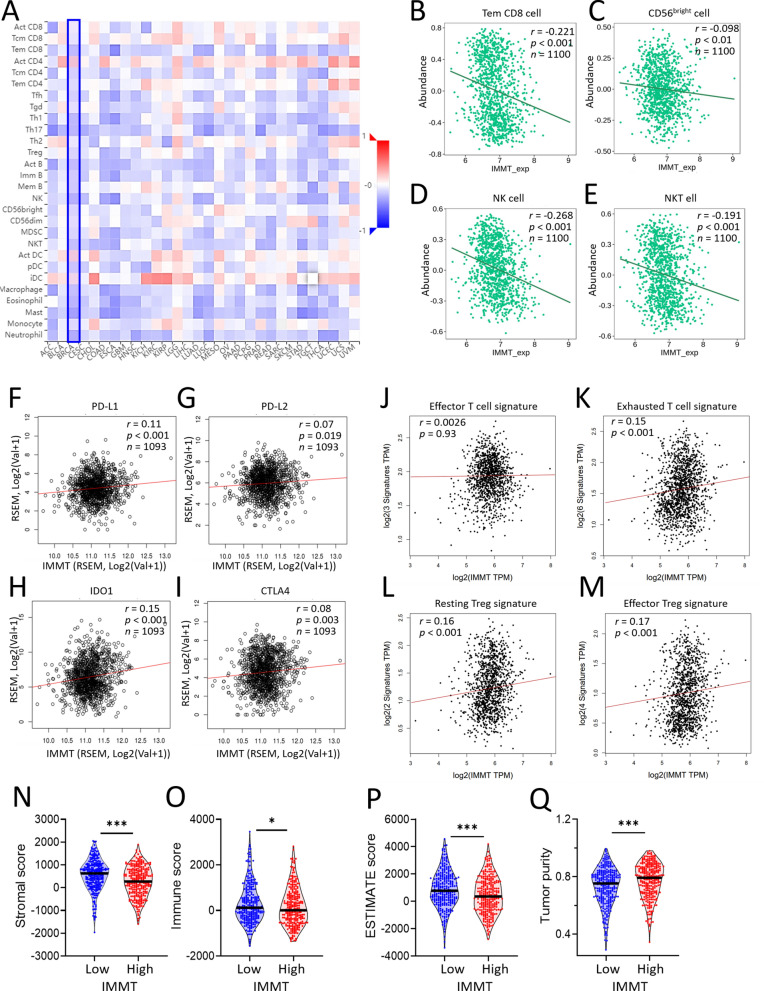
Fig. 6.
The role of IMMT in shaping TIME. A–M immunological analysis on immune infiltration and immunosuppressors. Heatmap showing the correlation between IMMT expression and lymphocytes infiltration across human cancers (A). Dot plots showing the correlation of IMMT with anti-tumor cell population such as effector memory CD8 T cell (Tem_CD8) (B), CD56bright killer cells (C), NK cells (D), NKT cells (E), with immunosuppressive molecules such as PD-L1 (F), PD-L2 (G), IDO1 (H), and CTLA4 (I), and with effector T cell signature (CX3CR1, FGFBP2 and FCGR3A) (J), with exhausted T cell signature (HAVCR2, TIGIT, LAG3, PDCD1, CXCL13 and LAYN) (K), with resting Treg cell signature (FOXP3 and IL2RA) (L), and with effector Treg cell signature (FOXP3, CTLA4, CCR8 and TNFRSF9) (M). Violin plots showing the stromal score (N), immune score (O), EXTIMATE score (P) and tumor purity (Q). *p < 0.01, **p < 0.01, and ***p < 0.001 between the low and high IMMT groups

