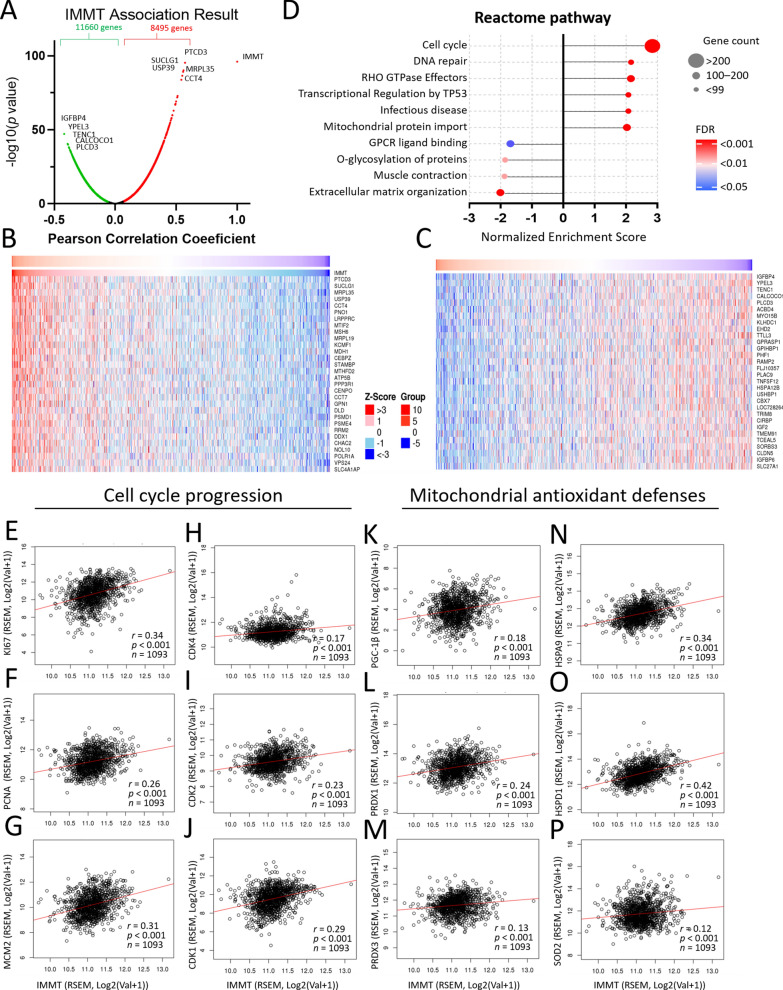
Fig. 7.
Involvement of IMMT in cell cycle progression and mitochondrial antioxidant defenses. Genetic and enrichment analyses of TCGA samples were conducted using the LinkedOmics functional modules. Volcano plot showing the PCC and p value of the IMMT-coexpressed genes (A). Heatmap showing top 30 positively (B) and negatively (C) correlated genes with IMMT. Bubble plot showing the normalized enrichment score, involved gene count and false discovery rate (FDR) of the Reactome pathway terms (D). Dot plots showing the correlation between IMMT and Ki67 (E), PCNA (F), and MCM2 (G), CDK4 (H), CDK2 (I) and CDK1 (J), PGC-1β (K), PRDX1(L), PRDX3(M), HSPA9(N), HSPD1(O), and SOD2(P)

