Fig. 8.
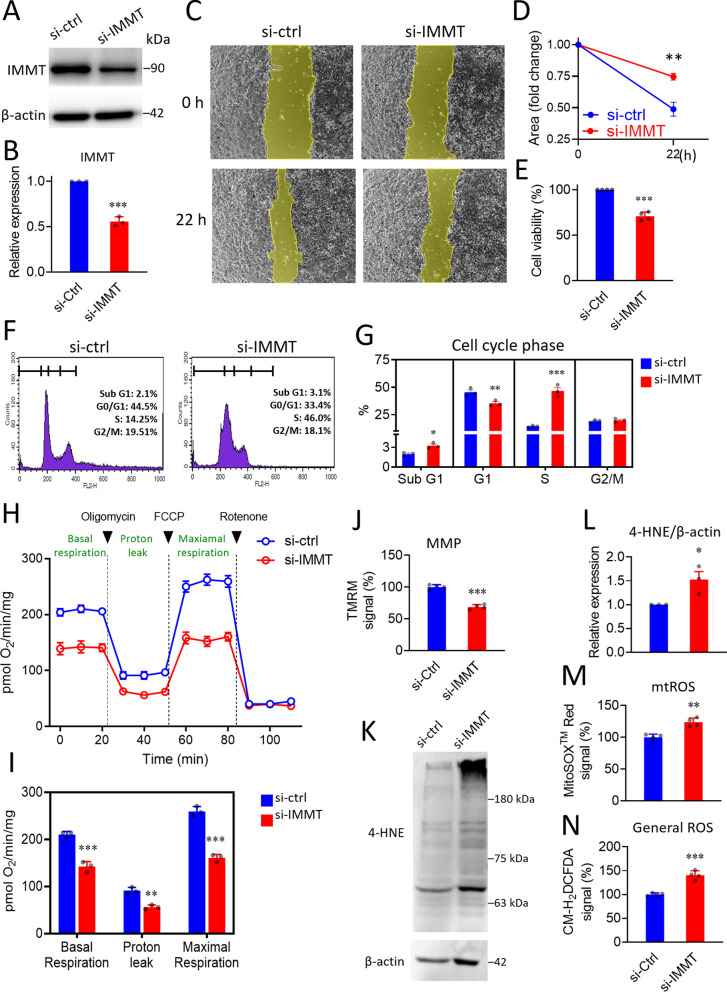
Knockdown of IMMT arrests the cell cycle and induces oxidative stress in BC cells. A–G Experimental verification of the biological role of IMMT on cancer cell biology. Representative western blot of IMMT in MDA-MB-231 cells treated with 20 nM negative control siRNA (si-ctrl) and IMMT siRNA (si-IMMT) for 72 h. β-actin serving as loading control (A). Bar chart showing the quantitative result of western blot (B). Representative images of wound healing assay at 0 h and 22 h (C). Quantification results of the wound area determined by the migrated cells (D). Cell viability evaluated by CCK-8 assay (E). Representative histograms of each cell cycle phase (F). Bar chart representing percentages of cell cycle phases (G). H–N Assessments of mitochondrial function and oxidative stress. Basal OCR (oxygen consumption rate), proton leak-OCR, and maximal OCR were measured in basal assay medium, 1 μM oligomycin, and 300 nM FCCP, respectively (H). Quantitative results of OCR (I). Mitochondrial membrane potential (MMP) determined by TMRM staining on a flow cytometer (J). Representative western blot of lipid peroxidation assessment by probing 4-HNE abundance. β-actin as loading control (K). Quantitative bar chart of 4-HNE abundance (L). The percentage of mitochondrial ROS (mtROS) and intracellular general ROS detected by MitoSOXTMRed (M), and CM-H2DCFDA (N), respectively. ***p < 0.001. **p < 0.01 and **p < 0.05

