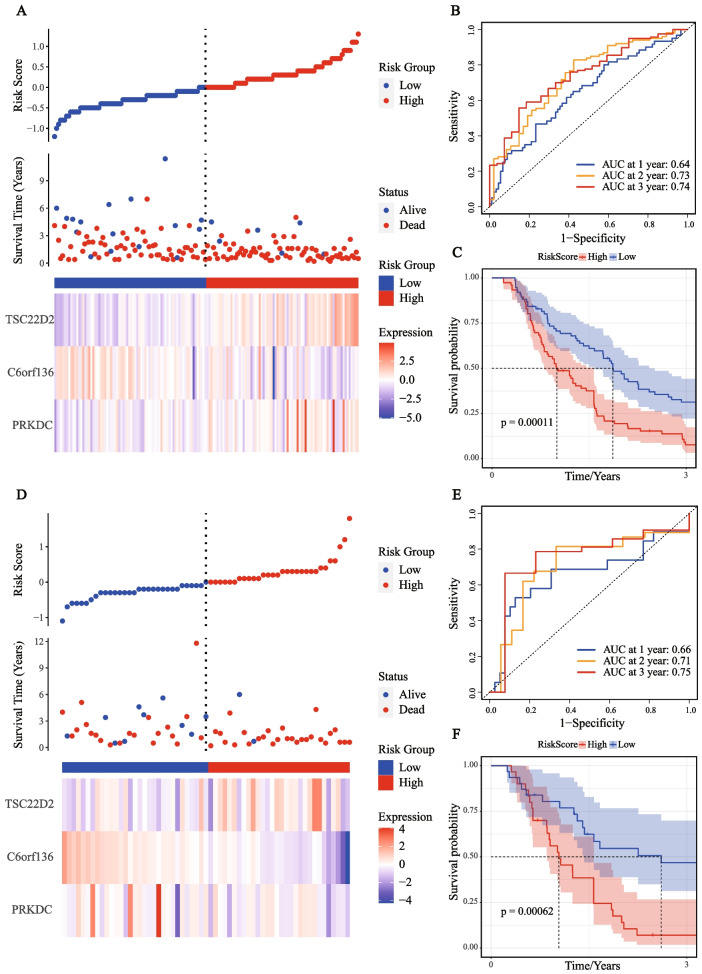
Fig. 2.
Construction and validation of the prognostic model in the training and validation sets. A The risk score, survival time, survival status, and 3-gene expression trend in the training set (ICGC, 152 samples). B ROC curves for the sensitivity and specificity of one-, two-, and three-year OS according to the risk score in the training set. C Kaplan–Meier curve for OS between the high- and low-risk groups in the training set. D The risk score, survival time, survival status, and 3-gene expression trend in the validation set (ICGC, 61 samples). E ROC curves for the sensitivity and specificity of one-, two-, and three-year OS according to the risk score in the validation set. F Kaplan–Meier curve for OS between the high- and low-risk groups in the validation set

