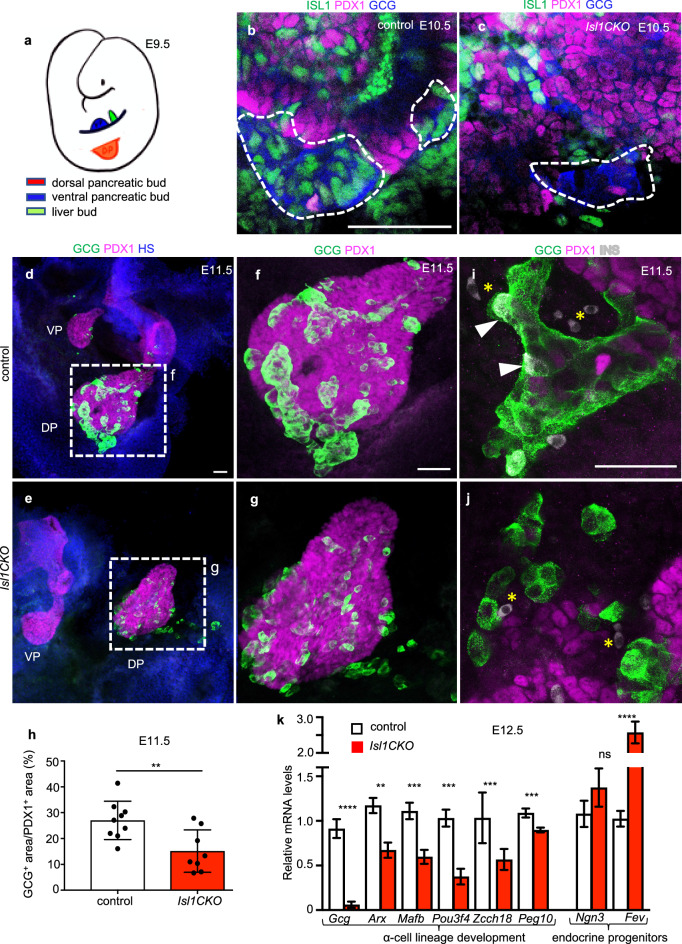
Fig. 4.
Aberrant α-cell lineage development during primary transition in the Isl1CKO pancreas. a Schematic presentation of the pancreas formation, which begins with the independent budding of the dorsal and ventral buds at the posterior region of the foregut. These two buds, surrounded by the mesenchyme, eventually fuse after rotation of the gut to form the pancreatic endoderm. b, c Representative higher-magnification images of whole-mount immunolabeling show a loss of ISL1 and glucagon (GCG) expressing cells in the dorsal pancreas of Isl1CKO at E10.5. d-g Whole-mount immunolabeling shows the formation of GCG+ clusters in the dorsal (DP) and ventral pancreatic buds (VP) at E11.5. Higher-magnification images show DP with GCG+ clusters. h Quantification of the GCG+ area in the PDX1+ domain shows the reduced size of GCG+ clusters in the dorsal pancreas of Isl1CKO (n = 8 pancreases) compared to controls (n = 9 pancreases). Data are presented as mean ± SD, Unpaired t-test, **P = 0.0069). i, j Representative images of whole-mount immunolabeling of the pancreas show endocrine cells co-expressing GCG and insulin (INS) in the control (arrowheads) but not in the Isl1CKO pancreas (asterisks indicate autofluorescent red blood cells). k Quantitative RT-PCR analyses of mRNA levels of Gcg and selected transcription factors in the E12.5 pancreas. Data are presented as mean ± SEM (n = 8 pancreases per genotype), Unpaired t-test (****P < 0.0001, ***P < 0.001, **P < 0.01, ns = not significant). Scale bars: 50 μm

