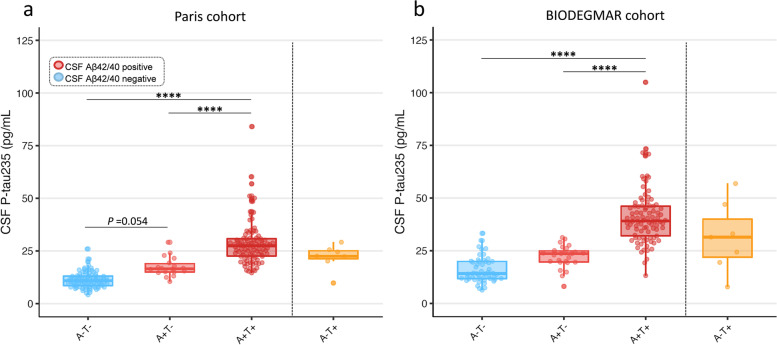
Fig. 3.
CSF levels of p-tau235 across AT groups. In both a the Paris cohort and b the BIODEGMAR cohort, CSF p-tau235 followed an increasing trajectory across the AT continuum. CSF p-tau235 was significantly increased in A+T+ when compared with A−T− and A+T−, and approached significance between A−T− and A+T− in the Paris cohort. Data information: Boxplots show the median, IQR, and all the participants colour-coded based on the presence (red) or absence (blue) of CSF amyloidosis measured with Lumipulse CSF Aβ1–42/40. P-values were determined using one-way ANOVA adjusted by age and sex, followed by Bonferroni-corrected post hoc comparison (*P <0.05, **P <0.01, ***P <0.001, ****P <0.0001)

