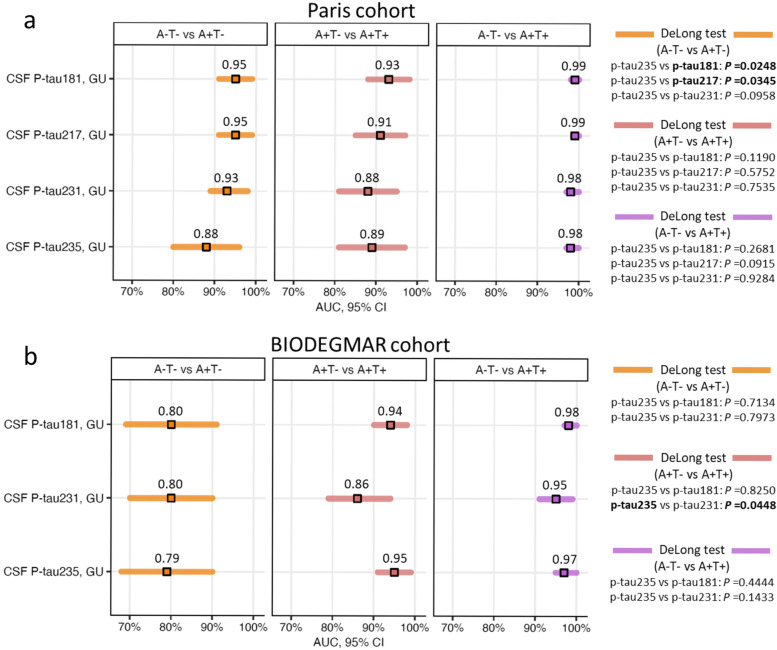
Fig. 4.
Diagnostic performance of CSF p-tau235 when discriminating AT groups. a In the Paris cohort, CSF p-tau235 showed high accuracies in all three scenarios. CSF p-tau235 performance discriminating A−T− from A+T− was lower than CSF p-tau181 and p-tau217, but matched that of CSF p-tau231. When differentiating A+T− from A+T+ and A−T− from A+T+, CSF p-tau235 matched the performance of CSF p-tau181, p-tau217 and p-tau231. b In the BIODEGMAR cohort, CSF p-tau235 displayed high accuracies in all three scenarios, equal to those of CSF p-tau181 and p-tau231, slightly outperforming the latter when discriminating A+T− from A+T+. Data information: Forest plots showing AUC values from ROC analysis (CI95% available in Supplementary Table 7). Comparisons of AUC values between CSF p-tau235 and other available CSF p-tau biomarkers were determined using DeLong test (significance is indicated in bold)

