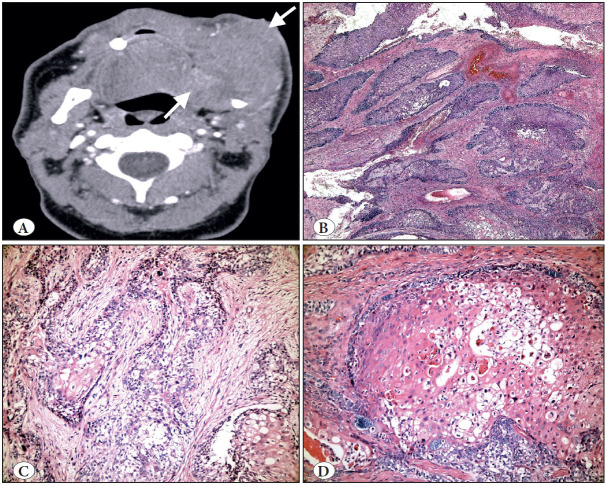
Figure 7.
Ameloblastic carcinoma. A) Axial CBCT view showing marked expansion, cortical destruction and soft tissue extension (arrows). B) Follicular growth where the tumor islands resemble those of ameloblastoma (H&E; x100). C) Neoplastic cells displaying significant cytologic atypia (H&E; x200). D) Marked atypia, dyskeratosis and clear cell change (H&E; x200).

