Supporting Movie 1
Supporting Figure 7

Favoreel et al. 10.1073/pnas.0409099102. |
Supporting Figure 6
Supporting Movie 1
Supporting Figure 7
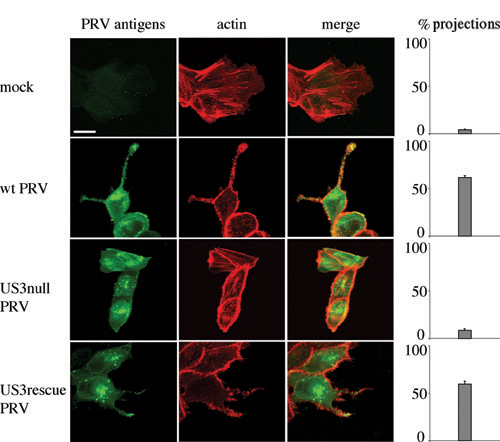
Fig. 6. US3 mediates the formation of long, actin-containing cell projections in PRV-infected RK13 cells. RK13 cells were either mock-infected or infected with wild-type, US3-null, or US3-rescue PRV at a multiplicity of infection of 10. Cells were paraformaldehyde-fixed at 7 h after infection, permeabilized, and stained for viral proteins (green) and actin (red). Arrowheads indicate cell projections. (Bar, 10 mm.) Graphs on the right show percentages of cell clusters that display projections (means ± SD of triplicate assays).

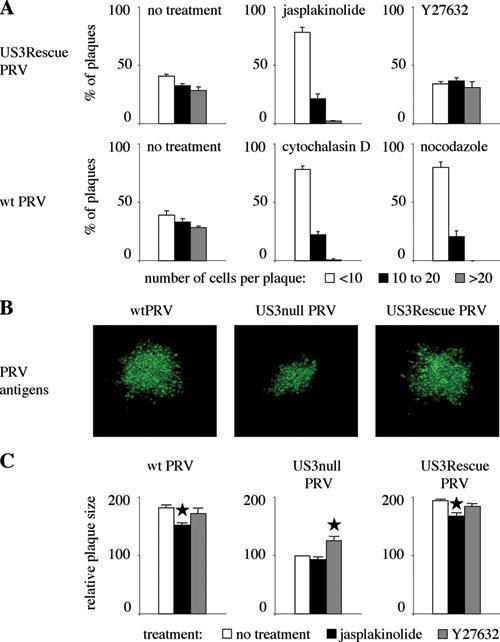
Fig. 7.
(A) Plaque sizes of US3-rescue (Upper) and wild-type pseudorabies virus (PRV) (lower row) at 24 h after infection (hpi) in sparsely plated swine testicle (ST) cells in the presence of virus-neutralizing antibodies and in the presence or absence of different drugs (50 nM jasplakinolide, 30 mM Y27632, 1 mM cytochalasin D, 30 mM nocodazole). Bars indicate number of cells per plaque (white, <10; black, 10-20; gray, >20). Data represent means ± SD of triplicate assays. (B) Representative plaques of wild-type, US3-null, and US3-rescue PRV at 24 hpi of confluent monolayers of ST cells in the presence of virus-neutralizing antibodies. (Bar, 50 mm.) (C) Plaque sizes of wild-type (Left), US3-null (Center), and US3-rescue (Right) PRV in the presence or absence of different drugs (white, no treatment; black, 50 nM jasplakinolide; gray, 30 mM Y27632). Plaque sizes are given as relative values compared to plaque sizes obtained using US3-null virus without drug treatment. Data represent means ± SD of triplicate assays. Asterisks indicate significant differences within one graph (P < 0.01).Movie 1.
Movement of pseudorabies virus (PRV) capsids in the US3-induced cell projections. Swine testicle (ST) cells were infected at a multiplicity of infection of 10 with a PRV strain that expresses a GFP-tagged VP26 capsid protein. At 6 hours after infection, a live cell imaging video was taken from a cell that displays a cellular projection (total duration: 910 s, taken with ± 10-s intervals). Multiple capsid movements can be observed, the vast majority of which occur in the direction of the tip of the projection. Movement of one capsid that starts at the base of the projection and moves all of the way to the tip of the projection is indicated with an arrow (corresponding with particle 2 in Fig. 3).