Supporting Figure 6
Supporting Text
Supporting Figure 7
Supporting Movie 1
Supporting Movie 2
Supporting Movie 3

Hwang et al. 10.1073/pnas.0501539102. |
Supporting Figure 5
Supporting Figure 6
Supporting Text
Supporting Figure 7
Supporting Movie 1
Supporting Movie 2
Supporting Movie 3
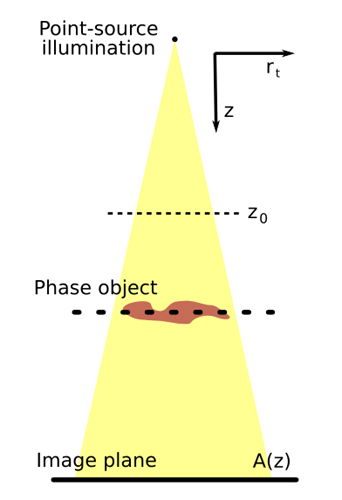
Fig. 5. Schematic diagram of a propagation-induced phase-contrast macroscope. This is essentially a bright-field optics with a point-source illumination. This seemingly simple optical arrangement projects the phase information of the specimen (cultured cardiac tissue) onto the image plane of charge-coupled device camera as a convoluted intensity variation (see Eq. 2 in Supporting Methods).

Fig. 6.
Schematic diagram illustrating the whole experimental setup including a phase optics, an incubation chamber, and a charge-coupled device camera.
Fig. 7.
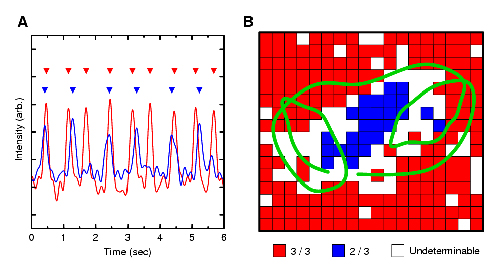
Identification of the partial conduction block associated with a period (P)-3 oscillatory spiral wave. (A) Two typical time series [one taken inside (blue, 2/3-dynamics) and the other taken outside the partial conduction block (red, 3/3-dynamics)]. (B) Periodicity map drawn around the spiral core trajectory (green). The 2/3-dynamics stands for 2 excitations only for 3 rotations of spiral wave (i.e., the third activation is blocked as the spiral rotates in the clockwise direction). For all pixels around the spiral tip trajectory, their time series are reviewed as in A, and the types are determined and rendered in B. The collection of blue pixels in the middle clearly supports the schematic diagram (the oval-shaped partial conduction block) depicted in Fig. 2H.Movie. 1.
Single-arm spiral in P-1, P-2, and P-3 states. Spatiotemporally filtered phase contrast images with tip trajectory orbit overdrawn in various shades of cyan. Cyan indicates the most recent location of the tip and the color turns progressively to gray as the location grows old. The Animated sequence is slowed down to 1/4 of the actual speed, and the field of view is 9 mm ´ 9 mm.Movie. 2.
Double-arm spiral in P-1, P-2, and P-4 states. Shown are spatiotemporally filtered phase-contrast images on left and AT map images on right with identified conduction blocks in white solid line segments on both sides. The color codes on AT map images are identical to those in Fig. 3. The animated sequence is slowed down to 1/4 of the actual speed, and the field of view is 15 mm ´ 15 mm.Movie. 3.
Double-arm spiral transition sequences from P-1 to P-2 and from P-2 to P-4. Sequences of the spatiotemporally filtered images and AT map images are shown as in Movie 2.