Goessel et al. 10.1073/pnas.0409730102. |

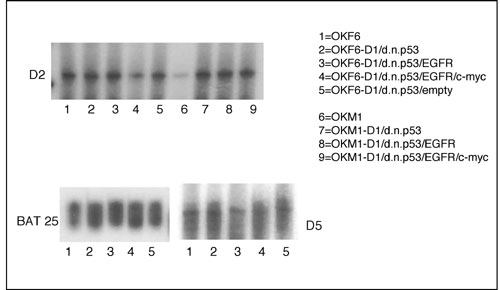
Fig. 7. Microsatellite markers in the generated oral keratinocytes. Microsatellite analysis on all generated cell strains was performed by PCR amplification. Expression of dinucleotide repeats D2 = D2S123 and D5 = D5S346 and the mononucleotide repeat BAT25 is displayed for OKF6, OKF6-D1/dnp53, OKF6-D1/dnp53/EGFR, OKF6-D1/dnp53/EGFR/c-myc, OKF6-D1/dnp53/empty, OKM1, OKM1-D1/dnp53, OKM1-D1/dnp53/EGFR, and OKM1-D1/dnp53/EGFR/c-myc.
Table 3. Molecular HLA class I and class II analysis
Cell type | HLA-A | HLA-B | HLA -DRB1 |
OKM1 | *01,*02 | *08, *40 | *03, *15 |
OKM1-D1/dnp53 | *01,*02 | *08, *40 | *03, *15 |
OKM1-D1/dnp53/EGFR | *01,*02 | *08, *40 | *03, *15 |
OKM1-D1/dnp53/EGFR/c-myc | *01,*02 | *08, *40 | *03, *15 |
OKF6 | *01,*02 | *08 | *03, *07 |
OKF6-D1/dnp53 | *01,*02 | *08 | *03, *07 |
OKF6-D1/dnp53/EGFR | *01,*02 | *08 | *03, *07 |
OKF6-D1/dnp53/EGFR/c-myc | *01,*02 | *08 | *03, *07 |
Nude mouse tumor | *01,*02 | *08 | *03, *07 |
HLA
class I and class II loci were amplified by PCR.. HLA class I (HLA-A and HLA-B) and class II (HLA-DRB1) alleles are displayed for the respective OKM1, OKF6, and nude mouse tumor-derived cells. Asterisks denote the number of the respective allele.