Schoups et al. 10.1073/pnas.0507723102. |

Fig. 5. Spatial distribution of soil salinity (A), sodium adsorption ratio (SAR) (B), soil calcite (C), and soil cation exchange capacity (CEC) (D) for the study area (solid black line) from the 1992 soil survey (1). There clearly is a correlation between salinity and SAR. Most saline soils are located on the finer-textured soils downslope. Calcite is present in all soils. The CEC varies from >400 meq/kg on the heaviest clay soils of the fan skirts to <50 meq/kg on the coarser upslope soils (1).
1. Natural Resources Conservation Service (2003) Soil Survey Geographic (SSURGO) Database for Fresno County, California, Western Part (U.S. Department of Agriculture, Fort Worth, TX).

Fig. 6. Comparison of observed (top row) and simulated (bottom row) water table depth maps (in meters below land surface) for 5 selected years. Brown, > 30 m; red, 16–30 m; yellow, 7–16 m; green, 3–7 m; light blue, 2–3 m; blue, <2 m. The x and y axes correspond to the model column and row numbers, respectively. The measurement map is much smoother than the simulated map, because kriging was used to interpolate between data collected from observation wells. The salt-and-pepper effect of the simulated maps is caused by contrasting land uses from cell to cell (irrigation efficiency, crop type, fallowing). The simulated variability is likely more realistic than the smoothed interpolated map. The model generally predicted the regional variation in water table depths very well, although there are some exceptions, for example, the overprediction of the shallow water table extent (<2 m, indicated by the blue area) in 1984.

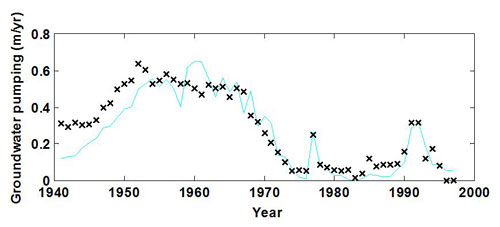
Fig. 7. Comparison of measured with simulated groundwater pumping rates for a 57-year period for Westlands water district. For the first 30 years, irrigation water was mostly provided by groundwater pumping but was replaced by surface water beginning in the late 1960s, after completion of the Central Valley Project and the State Water Project. Groundwater pumping increased again for short periods in the 1970s and early 1990s, corresponding with severe drought periods in California, resulting in reduced surface water supplies, coinciding with short periods of reduced drainage and deeper groundwater tables. In part, the underestimation of observed groundwater-pumping data in the early 1940s may be caused by uncertainties in the irrigated area during that period.

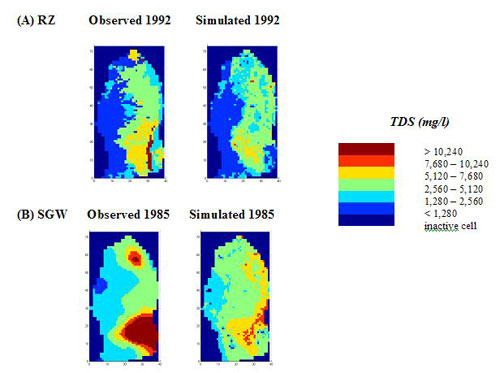
Fig. 8. Observed and simulated average root-zone (RZ) salinity (dS/m) (A) and shallow groundwater (SGW) salinity (TDS) (B), indicating that the simulated and observed soil salinity patterns are generally similar. Areas that are green, yellow, red, or brown designate a RZ ECe > 4 dS/m. The underestimation of salinity in the northeastern part of the study area is likely due to inadequate characterization of the on-farm drainage systems that control the shallow water table and salt leaching. The underpredicted RZ salinity in the Panoche-Cantua interfan region (southeastern part) corresponds with the lower than measured TDS SGW simulations. Historically, soil salinity values were always high in this region that corresponds with the highest SAR values (Fig. 5) of the study area and were subjected to less leaching, because of capillary rise from shallow water tables.