
Heise et al. 10.1073/pnas.0506109102. |
Fig. 6. Comparison between magic angle spinning (MAS) NMR spectra of U-[13C,15N] (red) and U-[13C,15N\K,V] (blue) a-synuclein. (a) Spin diffusion (SD) spectra taken at 14.1 T, with spinning speed of 11 kHz and 50-ms mixing time at –8°C. Red, t1max = 4.5 ms, total experiment time 21 h; blue, t1max = 4.1 ms, total experiment time = 8.5 h. (b and c) NCACX (b) and NCOCX (c) spectra with the following experimental conditions. Red, DARR (1) transfer for CC-mixing, with mixing times of 25 ms (b) and 30 ms (c); field strength, 14.1 T; spinning speed, 15 kHz; temperature, –5°C; t1max = 5.7 ms (b) and 5.2 ms (c); total experiment times, 40 h (b) and 61.5 h (c). Blue, SD for CC-mixing with mixing times of 40 ms (b) and 60 ms (c); field strength, 18.8 T; spinning speed, 12.5 kHz; temperature, –8°C; t1max = 8 ms; total experiment times, 18.5 h (b) and 26 h (c). Representative 1D slices of the heteronuclear correlation spectra were taken at the cross-sections indicated by the dotted lines. Chemical shifts for labeled amino acids do not change with the labeling pattern. Resonances from V and K are strongly suppressed. Resonances of amino acids followed by a K residue are missing in the NCOCX spectrum of U-[13C,15N\K,V] a-synuclein (as exemplified for one T residue from a KTK repeat unit; resonance indicated by a square), whereas resonances of amino acids followed by V are present in the spectrum (as shown for T54, resonances indicated by circles) (2).
1. Takegoshi, K., Nakamura, S. & Terao, T. (2001) Chem. Phys. Lett. 344, 631–637.
2. Waugh, D. S. (1996) J. Biomol. NMR 8, 184–192.

Fig. 7. 2D and 1D slices (taken at cross-sections indicated by the dotted lines) through the 3D CANCOCX (a, c, and e) and 3D NCACX (b, d, and f) spectra, taken from U-[13C,15N] a-synuclein, illustrating sequential resonance assignments for the stretch V52–V55. The spectra were recorded at 14.1 T at a temperature of –5°C with a spinning speed of 15 kHz. Homonuclear CC mixing was achieved by SD for 100 ms (NCACX) and 70 ms (CANCOCX). For the NCACX spectrum, maximum t1 and t2 evolution times were 3 and 2.8 ms, respectively; the total experiment time was 4.5 days. The CANCOCX spectrum was recorded with triangular acquisition (1), with maximum t1 and t2 evolution times of 2.6 and 2.8 ms, and a total experiment time of 13 days.
1. Heise, H., Seidel, K., Etzkorn, M., Becker, S. & Baldus, M. (2005) J. Magn. Reson. 173, 64–74.

Fig. 8. Assignments of resonances in U-[13C,15N\K,V] labeled a-synuclein in the A-form. (a) CC SD spectra with short (20 ms, red) and long (150 ms, blue) mixing times, as in Fig. 1. 1D slices of both spectra were taken at cross-sections indicated by dotted lines. (b and c) NCACX spectrum displaying intraresidue NC-cross-correlations (b) and NCOCX spectrum displaying interresidue Ni+1Ci contacts (c). All measurements were performed at 18.8 T at –8°C and a spinning speed of 12.5 kHz. Mixing times for SD were 20 ms (a, red), 150 ms (a, blue), 40 ms (b), and 60 ms (c). Total experiment times were a) 5.5 h (a, red) and 8.5 h (a, blue) and 18.5 h (b). Maximum t1 evolution times were 4 ms (a) and 8 ms (b and c).
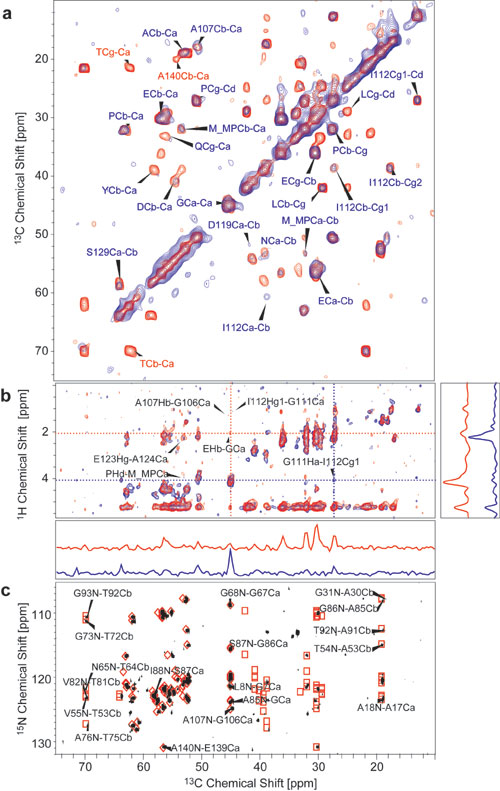
Fig. 9. Homonuclear and heteronuclear MAS NMR spectra displaying mobile parts of a-synuclein fibril samples. (a) 2D CC correlation spectra with TOBSY 9-3-1 transfer (1) for homonuclear through-bond mixing (mixing time: 6 ms), conducted on type A fibrils of U-[13C,15N/K,V] a-synuclein. Static field strength = 9.4 T; temperature = –5°C; spinning frequency = 8 kHz. Initial excitation of carbon magnetization in the two spectra was achieved by insensitive nuclei enhanced by polarization transfer (INEPT) excitation (2) (red) and a combination of a proton T2 relaxation filter (t = 100 ms) with CP transfer (2.5 ms contact time) obtained with the pulse sequence in Fig. 10c (blue). Maximum indirect evolution times were 4.7 ms each; total experiment times were 16 h (red) and 42 h (blue). Blue labels indicate cross-peaks occurring in both spectra; red labels indicate cross-peaks occurring only in the INEPT spectrum. (b) 1H,13C HETCOR spectra with longitudinal (1H,1H) mixing followed by a transverse proton dephasing delay of 400 ms before CP transfer (contact time 3 ms) as in Fig. 10b. Spectra were recorded on type A fibrils of U-[13C,15N/K,V] a-synuclein at 18.8 T at a temperature of –8°C with a spinning speed of 8 kHz. (1H,1H) mixing times of 15 ms (blue) and 30 ms (red) were used. The maximum t1 evolution time was 3.2 ms. Total experiment times were 20 h (blue) and 23.5 h (red). Representative 1D slices of the two spectra were taken along the dotted lines in the respective colors. (c) NCOCX spectrum with HN and NC inept transfers followed by homonuclear TOBSY mixing (mixing time = 7.6 ms) (3). Field strength = 18.8 T; spinning frequency = 8.333 kHz; sample temperature = –5°C; maximum indirect evolution time = 19.3 ms; total experiment time was 16 h. Red diamonds predict N-Ca cross-correlations; red squares predict N-Cb correlations from data obtained on monomeric a-synuclein (C. W. Bertoncini, C. Fernández, M. Zweckstetter, and C. Griesinger, personal communication).
1. Hardy, E. H., Verel, R. & Meier, B. H. (2001) J. Magn. Reson. 148, 459–464.
2. Morris, G. A. & Freeman, R. (1979) J. Am. Chem. Soc. 101, 760–762.
3. Andronesi, O. C., Becker, S., Seidel, K., Heise, H., Young, H. S. & Baldus, M. (2005) J. Am. Chem. Soc. 127, in press.

Fig. 10. Pulse sequences for T2-filter experiments. (a) 1D experiment with proton dephasing delay t, as applied for the spectrum in Fig. 2d. (b) H,C-Hetcor involving longitudinal (1H,1H) mixing and a proton T2 filter, as applied for the spectrum in Fig. 2e. (c) T2 filter experiment with carbon detection in both dimensions, using total through-bond-correlation spectroscopy (TOBSY) (1, 2) transfer for homonuclear mixing, as applied for the spectrum in Fig. 9a. Narrows bars indicate 90° pulses; broad bars indicate 180° pulses. Phase cycles are as follows. (a) j1 = {y,-y}4, j2 = {x,x,y,y,-x,-x,-y,-y}, jrec = {x,-x,y,-y,-x,x,-y,y}. (b) j1 = {y,-y}8, j2 = {y,y,-y,-y}4, j3 = {x4,y4,-x4,-y4} jrec = {x,-x,-x,x,y,-y,-y,y,-x,x,x,-x,-y,y,y,-y}. (c) j1 = {y,-y}8, j2 = {x,x,-x,-x}4, j3 = {x4,y4,-x4,-y4} jrec = {x,-x,-x,x,y,-y,-y,y,-x,x,x,-x,-y,y,y,-y}.
1.Baldus, M. & Meier, B. H. (1996) J. Magn. Reson. Ser. A 121, 65–69.
2. Hardy, E. H., Verel, R. & Meier, B. H. (2001) J. Magn. Reson. 148, 459–464.
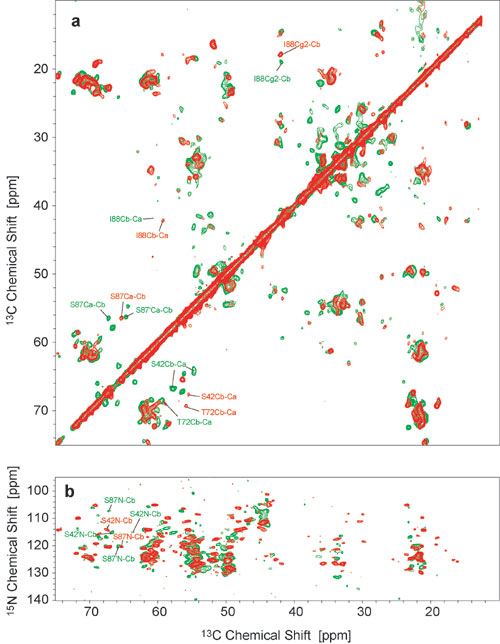
Fig. 11. Comparison between spectra of type A (red) and type B (green) fibrils. (a) 2D SD spectra with a mixing time of 20 ms each, with representative assignments for both fibril types in the respective colors. (b) NCACX correlation spectra with a SD mixing time of 40 ms each. Spectra were recorded at 18.8 T, with spinning frequencies of 12.5 kHz at temperatures of –8°C (red) and –13°C (green). Maximum t1 evolution times were 4 ms (a) and 8 ms (b); total experiment times were 5.5 h (a) and 24 h (b).