Barnés et al. 10.1073/pnas.0509579102. |
Fig. 4. Hierarchical clustering of tissue samples (with respect to expression of 7,815 genes) by using a variety of methods for building the dendrograms. (a) Single linkage. (b) Complete linkage. (c) Increase in sum of squares. (d) Sum of squares. (e) Density (k = 3). (f) Density (k = 16). (g) Mean proximity. Clustering was based on the 63 × 63 distance matrix for the 63 tissue samples. Gene expression "signal" values were log2-transformed, and the samples were standardized to the z score before calculating the squared Euclidean distance De or Dc = | r – 1|, where r = Pearson correlation coefficient, as distance metric. Clustering was performed by using clustan 6.0 (Clustan, Ltd., Edinburgh). For both standardized (z score) and nonstandardized data, analysis based on De or Dc resulted in the same clusters, including coclustering of hemangioma samples (H)-placental samples (P). Dendrograms were identical for De and Dc only with the standardized data, indicating that the z score transformation provided robustness with respect to the choice of distance metric. Shown above are the dendrograms by using De as distance metric with standardized data.
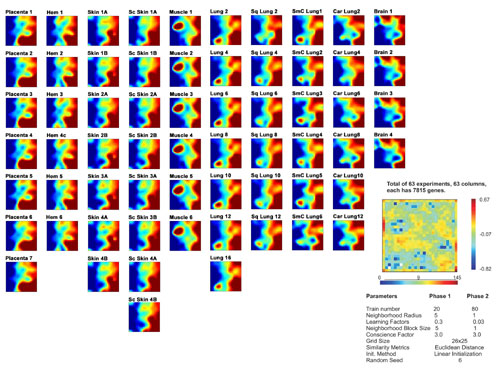
Fig. 5. Self-organizing maps of all samples, visualized by using gene expression data inspection software gedi (1). Gene density map and parameters, calculated by using 63 samples and 7,815 genes. Individual samples grouped by tissue type are shown in individual columns for facile comparison.
1. Eichler, G. S., Huang, S. & Ingber, D. E. (2003) Bioinformatics 19, 2321–2322.
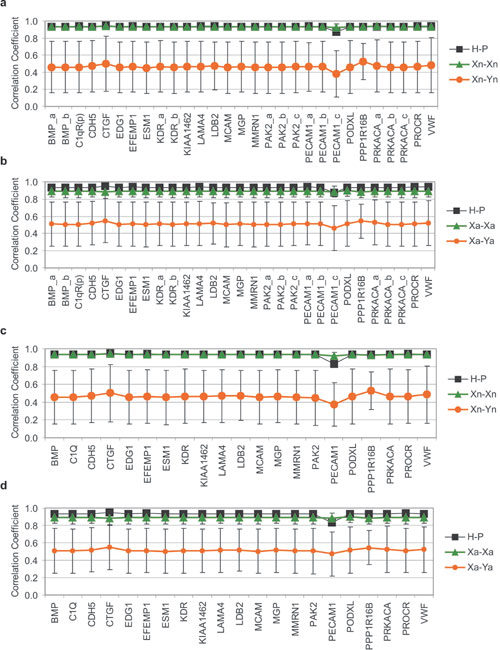
Fig. 6. Jackknife analysis: correlation coefficient of EC-associated set after removing a single probe (a and b) or a single gene (c and d). Comparison of average correlation coefficient of all same-tissue pair comparisons (X-X) and different-tissue pair comparisons (X-Y) to the correlation coefficient of H-P. Note that in every case, the correlation coefficient of H-P is comparable to that of X-X. Xn-Xn and Xn-Yn correspond to comparisons of normal tissue pairs only (a and c), whereas Xa-Xa and Xa-Ya correspond to comparisons of all (normal and diseased) tissue pairs (b and d).

Fig. 7. Genes differentially expressed in placenta and hemangioma relative to X control tissues. X = 4 normal and 4 diseased control tissues (red subset), or 4 normal control tissues only (gray subset), and H/X ³ 3 and P/X ³ 3. Normal control tissues include brain, lung, muscle, skin, and diseased control tissues include sclerodermic skin (Sc Skin) and pulmonary tumors: lung carcinoid (Car Lung), squamous cell carcinoma (Sq Lung), and small cell carcinoma (SmC Lung). Individual samples represented in each box. (a) Color map of individual normalized signal values. (b) Significance of signal values, indicated by presence/absence of call (Affymetrix).
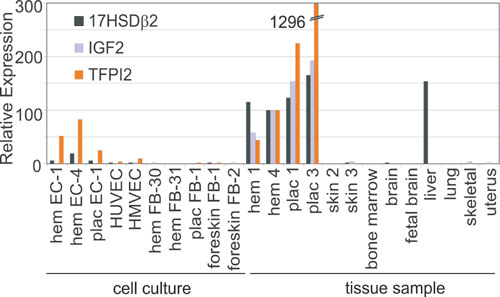
Fig. 8. Hemangioma and placental gene expression of 17-b hydroxysteroid dehydrogenase type II (17HSDb2), insulin-like growth factor II (IGF2), and tissue factor pathway inhibitor 2 (TFPI2) by quantitative RT-PCR. EC and fibroblasts (FB) are from hemangioma (hem EC and hem FB), placenta (plac EC and plac FB), human umbilical vein (HUVEC), and neonatal foreskin (HMVEC or foreskin FB).
Table 3. Data from human tissues used in array comparison (2 pages)
Tissue | Sample identifier | Sample identifier in ref. | Age/gender | Ref. |
Brain | B 1 | B_26M | 26/M | 1 |
Brain | B 2 | B_36F | 36/F | 1 |
Brain | B 3 | B_37M | 37/M | 1 |
Brain | B 4 | B_38F | 38/F | 1 |
Hemangioma | H 1 | HEM005 | 6m/M | |
Hemangioma | H 2 | HEM016 | 7m/F | |
Hemangioma | H 3 | HEM019 | 4m/F | |
Hemangioma | H 4 | HEM020 | 5m/M | |
Hemangioma | H 5 | HEM021 | 2m/F | |
Hemangioma | H 6 | HEM012 | 5m/F | |
Lung | L 2 | NL1884 | n.a. | 2 |
Lung | L 4 | NL6084 | n.a. | 2 |
Lung | L 6 | NL3681 | n.a. | 2 |
Lung | L 8 | NL1179 | n.a. | 2 |
Lung | L 10 | NL1675 | n.a. | 2 |
Lung | L 12 | NL268n1 | n.a. | 2 |
Lung | L 14 | NL1698 | n.a. | 2 |
Lung | L 16 | NL6853 | n.a. | 2 |
Muscle | M 1 | T147 | 4yr/F | 3 |
Muscle | M 2 | T146 | 1yr/M | 3 |
Muscle | M 3 | T141 | 2yr/M | 3 |
Muscle | M 4 | T148 | 5yr/F | 3 |
Muscle | M 5 | T142 | 2yr/F | 3 |
Muscle | M 6 | T144 | 6yr/M | 3 |
Placenta | P 1 | TPV3 | Term/n.d. | |
Placenta | P 2 | TPV4 | Term/n.d. | |
Placenta | P 3 | TPV5 | Term/n.d. | |
Placenta | P 4 | TPV6 | Term/n.d | |
Placenta | P 5 | TPV7 | Term/n.d | |
Placenta | P 6 | TPV1 | Term/n.d | |
Placenta | P 7 | TPV2 | Term/n.d | |
Skin | S 1A | 1.N. Nor1-FA | 39y/M | 4 |
Skin | S 1B | 2.O. Nor1-B | 39y/M | 4 |
Skin | S 2A | 3.P. Nor2-FA | 58y/F | 4 |
Skin | S 2B | 4.Q. Nor2-B | 58y/F | 4 |
Skin | S 3A | 5.R. Nor3-FA | 58y/F | 4 |
Skin | S 3B | 6.T. Nor4-FA | 41y/F | 4 |
Skin | S 4A | 7.U. Nor4-B | 41y/F | 4 |
Squamous lung | Sq 2 | SQ6T1 | n.a. | 2 |
Squamous lung | Sq 4 | SQ3624 | n.a. | 2 |
Squamous lung | Sq 6 | SQ1174 | n.a. | 2 |
Squamous lung | Sq 8 | SQ4T1 | n.a. | 2 |
Squamous lung | Sq 10 | SQ8T1 | n.a. | 2 |
Squamous lung | Sq 12 | SQ6147 | n.a. | 2 |
Carcinoid lung | Car 2 | COID13T1 | n.a. | 2 |
Carcinoid lung | Car 4 | COID6T1 | n.a. | 2 |
Carcinoid lung | Car 6 | COID16T1 | n.a. | 2 |
Carcinoid lung | Car 8 | COID10T1 | n.a. | 2 |
Carcinoid lung | Car 10 | COID9T1 | n.a. | 2 |
Carcinoid lung | Car 12 | COID4518 | n.a. | 2 |
Small cell | SmC 1 | SMCL9T1 | n.a. | 2 |
Small cell | SmC 2 | SMCL5937 | n.a. | 2 |
Small cell | SmC 3 | SMCL4T1 | n.a. | 2 |
Small cell | SmC 4 | SMCL3T1 | n.a. | 2 |
Small cell | SmC 5 | SMCL301 | n.a. | 2 |
Small cell | SmC 6 | SMCL8T1 | n.a. | 2 |
Scleroderma | Sc 1A | 1.F. SSc1-FA | 41y/M | 4 |
Scleroderma | Sc 1B | 2.G. SSc1-B | 41y/M | 4 |
Scleroderma | Sc 2A | 3.H. SSc2-FA | 54y/M | 4 |
Scleroderma | Sc 2B | 4.I. SSc2-B | 54y/M | 4 |
Scleroderma | Sc 3A | 5.J. SSc3-FA | 62y/F | 4 |
Scleroderma | Sc 3B | 6.K. SSc3-B | 62y/F | 4 |
Scleroderma | Sc 4A | 7.L. SSc4-FA | 58y/F | 4 |
Scleroderma | Sc 4B | 8.M. Nor1-FA | 39y/M | 4 |
n.a., not available; muscle, normal skeletal muscle from quadriceps; brain, normal brain from frontal lobe; hemangioma, infantile hemangioma from cutaneous lesions; placenta, normal term placentas from chorionic villi section (Placenta 1–5 and 7) or from chorionic plate (Placenta 6).
1. Lu, T., Pan, Y., Kao, S. Y., Li, C., Kohane, I., Chan, J. & Yankner, B. A. (2004) Nature 429, 883–891.
2. Bhattacharjee, A., Richards, W. G., Staunton, J., Li, C., Monti, S., Vasa, P., Ladd, C., Beheshti, J., Bueno, R., Gillette, M., et al. (2001) Proc. Natl. Acad. Sci. USA 98, 13790–13795.
3. Sanoudou, D., Haslett, J. N., Kho, A. T., Guo, S., Gazda, H. T., Greenberg, S. A., Lidov, H. G. W., Kohane, I. S., Kunkel, L. M. & Beggs, A. H. (2003) Proc. Natl. Acad. Sci. USA 100, 4666–4671.
4. Whitfield, M. L., Finlay, D. R., Murray, J. I., Troyanskaya, O. G., Chi, J.-T., Pergamenschikov, A., McCalmont, T. H., Brown, P. O., Botstein, D. & Connolly, M. K. (2003) Proc. Natl. Acad. Sci. USA 100, 12319–12324.
Table 4. Differentially expressed endothelial cell genes used in Fig. 3
U95Av/2 | Accession no. | Gene name | Symbol | Fold Diff.* |
1733_at | AA424833 | Bone morphogenetic protein 6 | BMP6 | 6.5 |
39279_at | AA424833 | Bone morphogenetic protein 6 | BMP6 | 6.5 |
35036_at | AA150505 | Complement component 1, q subcomponent, recept. 1 | C1qR(p) | 29.1 |
37196_at | H02884 | Cadherin 5, type 2, VE-cadherin | CDH5 | 23.5 |
36638_at | AA598794 | Connective tissue growth factor | CTGF | 4.2 |
587_at | N93476 | Endothelial differentiation, sphingolipid G-protein-coupled recept, 1 | EDG1 | 10.4 |
32551_at | AA875933 | EGF-containing fibulin-like extracellular matrix protein 1 | EFEMP1 | 25 |
33534_at | W46577 | Endothelial cell-specific molecule 1 | ESM1 | 27.6 |
1954_at | AA026831 | Kinase insert domain receptor (a type III recept. Tyr kinase) | KDR | 5.5 |
690_s_at | AA026831 | Kinase insert domain receptor (a type III recept. Tyr kinase) | KDR | 5.5 |
38351_at | AA418988 | KIAA1462 | KIAA1462 | 5 |
37671_at | Z99289 | Laminin a 4 chain | LAMA4 | 4.9 |
36065_at | AF064493 | LIM domain binding 2 | LDB2 | 5.9 |
797_at | AI888888 | Melanoma cell adhesion molecule | MCAM | 11.6 |
36683_at | AA155913 | Matrix Gla protein | MGP | 5.6 |
35664_at | AA423867 | Multimerin 1 | MMRN1 | 48.3 |
1245_i_at | AF092132 | p21 (CDKN1A)-activated kinase 2 | PAK2 | 4.5 |
1560_g_at | AF092132 | p21-activated protein kinase (Pak2) | PAK2 | 4.5 |
34329_at | AF092132 | p21 (CDKN1A)-activated kinase 2 | PAK2 | 4.5 |
268_at | M28526 | Platelet/endothelial cell adhesion molecule-1 | PECAM1† | 18.8 |
37397_at | M28526 | Platelet/endothelial cell adhesion molecule-1 | PECAM1 | 18.8 |
37398_at | M28526 | Platelet/endothelial cell adhesion molecule-1 | PECAM1 | 18.8 |
40434_at | N64508 | Podocalyxin-like protein | PODXL | 8.2 |
41577_at | AI279830 | Protein phosphatase 1, regulatory (inhibitor) subunit 16B | PPP1R16B | 6.9 |
438_at | W68141 | Protein kinase, cAMP-dependent, catalytic, a | PRKACA | 5.2 |
568_at | W68141 | Protein kinase, cAMP-dependent, catalytic, a | PRKACA | 5.2 |
569_g_at | W68141 | Protein kinase, cAMP-dependent, catalytic, a | PRKACA | 5.2 |
647_at | T47442 | Protein C receptor, endothelial (EPCR) | PROCR | 5 |
607_s_at | AA485883 | von Willebrand factor | vWF | 10 |
*Data from Ho, M., Yang, E., Matcuk, G., Deng, D., Sampas, N., Tsalenko, A., Tabibiazar, R., Zhang, Y., Chen, M., Talbi, S., et al. (2003) Physiol. Genomics 13, 249–262.
†
Average of all PECAM1 transcripts (8.8- to 55.5-fold change).Table 5. Oligonucleotides used for Quantitative RT-PCR
Target | Name | Sequence 5'-3' | Product size, bp | Annealing temp., ºC |
TFPI2 | Forward Reverse | CGGATTGAGAACAGGTTTCCAGATGAAGC AATAGCGAGTCACATTGGCAGAGCACAGTC | 124 | 60 |
HSD17B2 | Forward Reverse | GCCGTGAACTTCTTTGGAACTGTGGAGGTC GCCGCCTTTGATGAGCCATAAGATGCC | 146 | 63 |
IGF2 | Forward Reverse | TCGCCGGCTTCCAGACACCAAT CGGTAAGCAGCAATGCAGCACGAG | 100 | 60 |
b2M | Forward Reverse | CAATCCAAATGCGGCATCTTCAAAC GAATGGAGAGAGAATTGAAAAAGTGGAGCA | 217 | 60 or 63 |
Primer sequences were designed in oligo 5.0 and obtained from Integrated DNA Technologies. RNA from normal samples (0.2–0.5 mg) was reverse-transcribed to cDNA and amplified by real-time quantitative PCR in 40 cycles by using Quantitect SYBR Green RT-PCR kit (Qiagen). PCR amplification reactions were performed and analyzed in an option 2.0 detection system (MJ Research) or in a Mx4000 multiplex quantitative PCR system (Stratagene).