Yu et al. 10.1073/pnas.0511154103. |
Supporting Figures
Files in this Data Supplement:
Supporting Figure 6
Supporting Figure 7
Supporting Figure 8
Supporting Figure 9

Fig. 6. (A) Dihydroethidium (DHE) was used in H9c2 cells for reactive oxygen species (ROS) measurement in high glucose incubation. (Left) Phase contrast (PH) images of cells; (Right) ethidium fluorescence in nuclei resulting from oxidation of DHE by ROS. Stronger ethidium fluorescence was observed at 15- and 30-min incubation in high glucose media. (B) Quantification of fluorescence intensity indicates that the high glucose-induced ROS increase is transient.

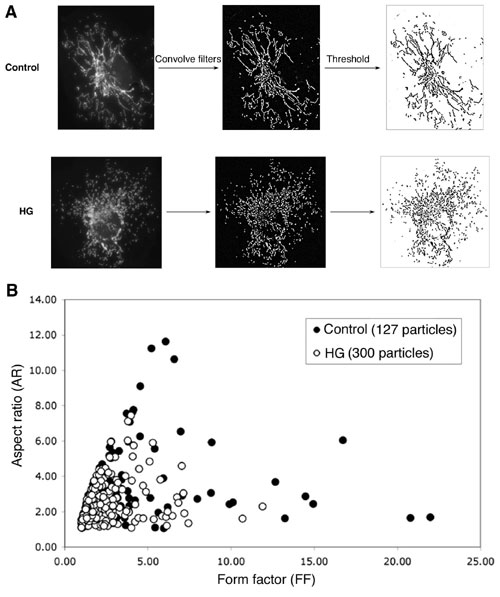
Fig. 7. Computer-assisted quantitative analyses of mitochondrial morphology. (A) Digital images were subjected to a convolve filter through the National Institutes of Health-developed IMAGEJ software to isolate and equalize fluorescent pixels in the image. After thresholding, individual particles (mitochondria) were analyzed for circularity (4p ´ Area/(perimeter2)) and lengths of major and minor axes. From these values, we calculated form factor (FF; the reciprocal of circularity value) and aspect ratio (AR; major/minor). Both FF and AR have a minimal value of 1 when a particle is a small perfect circle and the values increase as the shape becomes elongated. Specifically, AR is a measure of mitochondrial length, and increase of FF represents increase of mitochondrial length and branching. (B) Plotting AR against FF shows that particles analyzed from the cell in high glucose had lower values of FF and AR (open circles, crowded at the lower left-hand corner) compared to the control (filled circles). These low values indicate that mitochondria are small and circular in this cell. In addition, the number of mitochondria picked up by this analysis program were 127 and 300 for the cells from normal and high glucose, respectively. Increased number with concomitant decrease of AR and FF of mitochondria indicates mitochondrial fragmentation in high glucose.

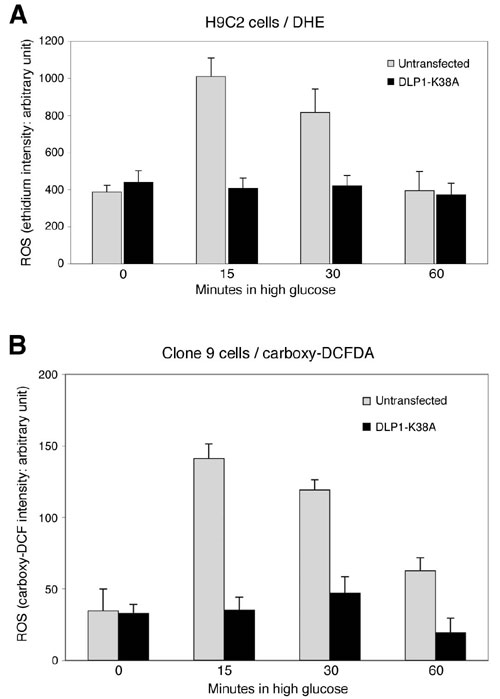
Fig. 8. (A) H9c2 cells were transfected with GFP-DLP1-K38A and ROS levels were measured by using DHE in high glucose incubation. Cells overexpressing GFP-DLP1-K38A did not show the transient increase of ROS. (B) Clone 9 cells were cotransfected with DLP1-K38A and red fluorescent protein to identify transfected cells. ROS levels were measured by using carboxy-H2DCFDA upon exposure to high glucose concentration. ROS levels remained low in transfected cells during high glucose incubation.

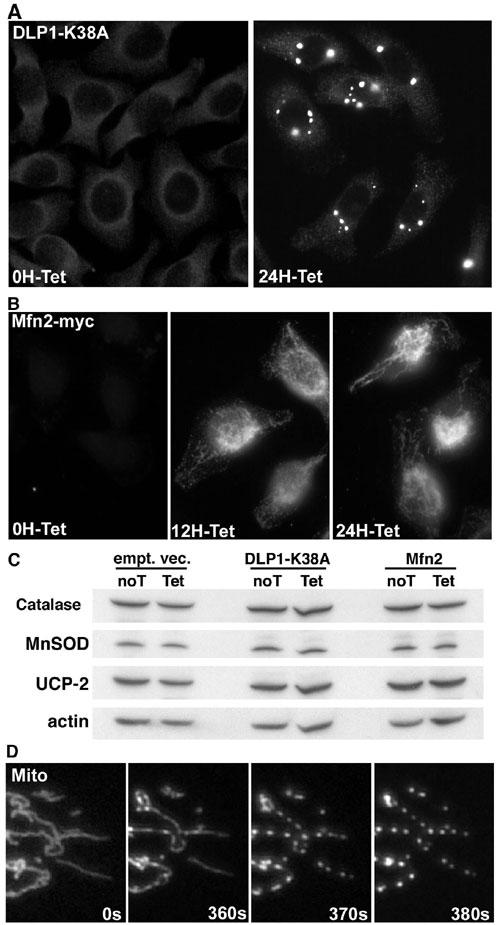
Fig. 9. (A) HeLa cells that overexpress DLP1-K38A in a tetracycline-inducible manner were immunostained with anti-DLP1 antibodies. (Left) In the absence of tetracycline, immunostaining showed a dim perinuclear pattern representing background endogenous DLP1. (Right) Upon induction with tetracycline for 24 h, distinct bright aggregates were visible, indicating DLP1-K38A overexpression. (B) Mfn2 was tagged with the myc epitope at the C terminus (Mfn2-myc). Mfn2-myc was overexpressed in HeLa cells by tetracycline induction and immunostainied with anti-myc antibodies. (Left) No Mfn2-myc was expressed without tetracycline addition. Tetracycline induction for 12 h showed expression of Mfn2-myc in mitochondria. (Center) Mitochondria appeared normal showing tubular and some punctate morphology. (Right) Tetracycline incubation for 24 h resulted in pronounced elongation of mitochondrial tubules, indicating that mitochondrial fusion was increased. (C) Immunoblot of uninduced (noT) and induced (Tet) cell extracts from tetracycline-inducible cell lines (cells carrying an empty vector, DLP1-K38A, and Mfn2). Levels of MnSOD, catalase, and UCP-2 showed no change after tetracycline induction. Actin levels were used as loading control. (D) Frames from time-lapse imaging of mitochondria in cells exposed to high glucose conditions. Tubular mitochondria were rapidly fragmented within 10 seconds. All fission events appeared concurrent, resulting in mitochondrial fragmentation.


